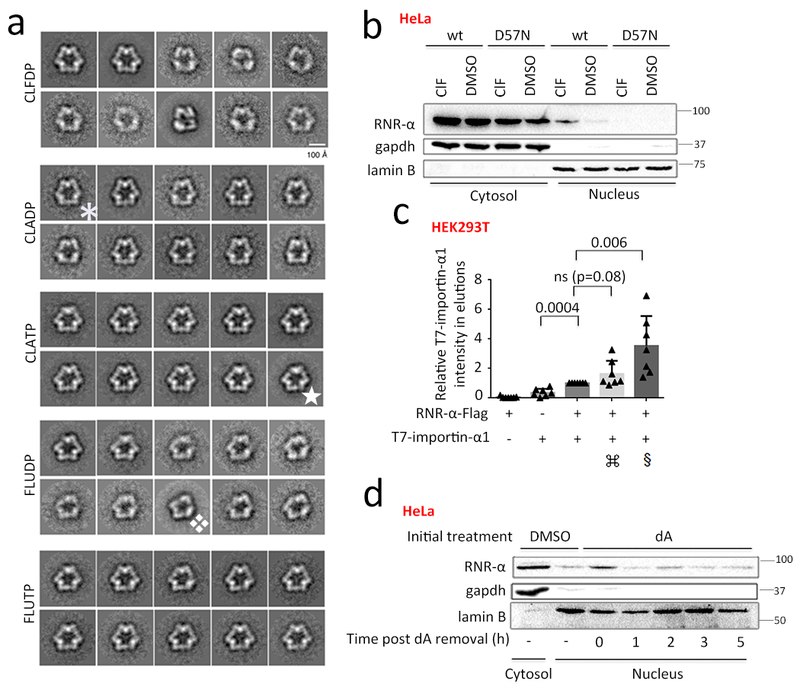
Figure 4. RNR-α-nuclear-translocation is functionally linked to RNR-α6RD hexamerizationdriven by dATP and its mimetics.

(a) Conformational variability (e.g., ✱, ✯, ❖) of the RNR-α6RD-hexamers induced by nucleotides [ClAD(T)P and FlUD(T)P] visualized by transmission electron microscopy. Images show class-averages representing the multiple conformations adopted by these oligomers. For each nucleotide, a data set of ~2000 particle images was collected and subjected to a maximum likelihood classification approach, assuming the existence of ten classes. RNR-α6RD-hexamers were assembled in the presence of the indicated nucleotide. In the dilution step before preparing the grids, the nucleotide was not included (see Methods). See also Supplementary Fig. 22–23 and Supplementary Table 1. (b) ClF (5 μM, 3-h)/DMSO-treated cells expressing wt-RNR-α-2XFlag or hypomorphic oligomerization- & nuclear-import-defective-mutant—RNR-α(D57N)-2XFlag, were analyzed by fractionation/western blot (HeLa). See also Supplementary Fig. 20f, 24–26. (c) Importin preferentially interacts with α6RD-hexamers: lysates from HEK293T cells expressing the indicated transgenes were subjected to Flag-IP. Additive: ⌘ and § indicate either dA (1 mM) or ClF (5 µM) in media (3 h), and either dATP (100µM) or ClFTP (5 µM) in IP-buffer, respectively; quantitation from 7 independent replicates. Data show mean +/− s.d. Two-tailed t-test was applied. N indicates biologically independent experiments. Also see Supplementary Fig. 27. (d) Fractionation and western blot analysis of nuclear RNR-α levels following pre-treatment of HeLa cells with dA (1 mM, 3 h) and subsequent removal of dA from media. See Supplementary Fig. 28a (quantitation) and 28b–g. For full-view blots relevant to Fig. 4 and supplementary figures referred to above, see Supplementary Fig. 35–41. EM images and WB images are representatives of n=2 biologically independent experiments with similar results.
