
Figure 5. IRBIT regulates nucleus:cytosol levels of endogenous RNR-αthrough cytosol anchoring of RNR-α6RD-hexamers.
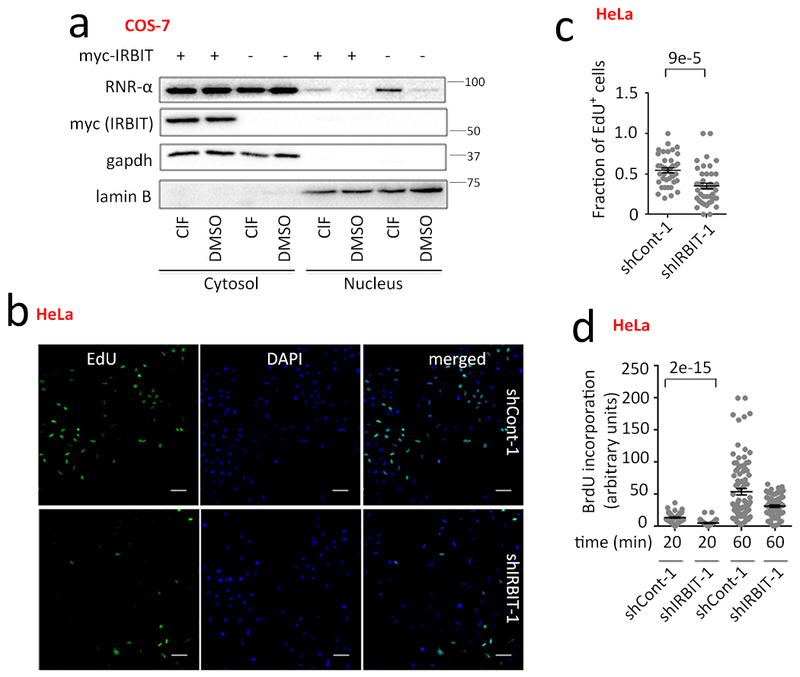
(a) IRBIT overexpression antagonizes endogenous RNR-α-partial nuclear translocation. Nucleus:cytosol-fractionation of COS-7 cells transiently transfected with either myc-IRBIT or vector-alone were treated subsequently with ClF/DMSO (5 μM, 3 h). WB images are representatives of n=3 biologically independent experiments with similar results. Supplementary Fig. 29–31. (b–d) IRBIT-knockdown causes DNA-synthesis-suppression: (b) as judged by EdU-staining analysis, and (c) quantitation [Data show mean +/− s.e.m. ~500-cells over more than 35 frames per condition (shCont-1 n=39; sh-IRBIT n=44, where n indicates separate frames from a specific plate]. IF images are representatives of n=3 biologically independent experiments with similar results. (d) Relative BrdU-incorporation-rate (in EdU-positive-cells) during the labeling-time-course. Data show mean +/−s.e.m. (shCont-1, 20 min, n=88; shIRBIT-1, 20 min, n=67; sh-Cont-1, 60 min, n=92; shIRBIT-1, 60 min, n=77; where n indicates number of cells measured). See also Supplementary Fig. 31c. For full-view blots relevant to Fig. 5 and supplementary figures referred to above, see Supplementary Fig. 37–41. Two-tailed t-test was applied in Fig. 5(c-d). See Statistics and Reproducibility section for sample size n. n indicates number of cells measured.