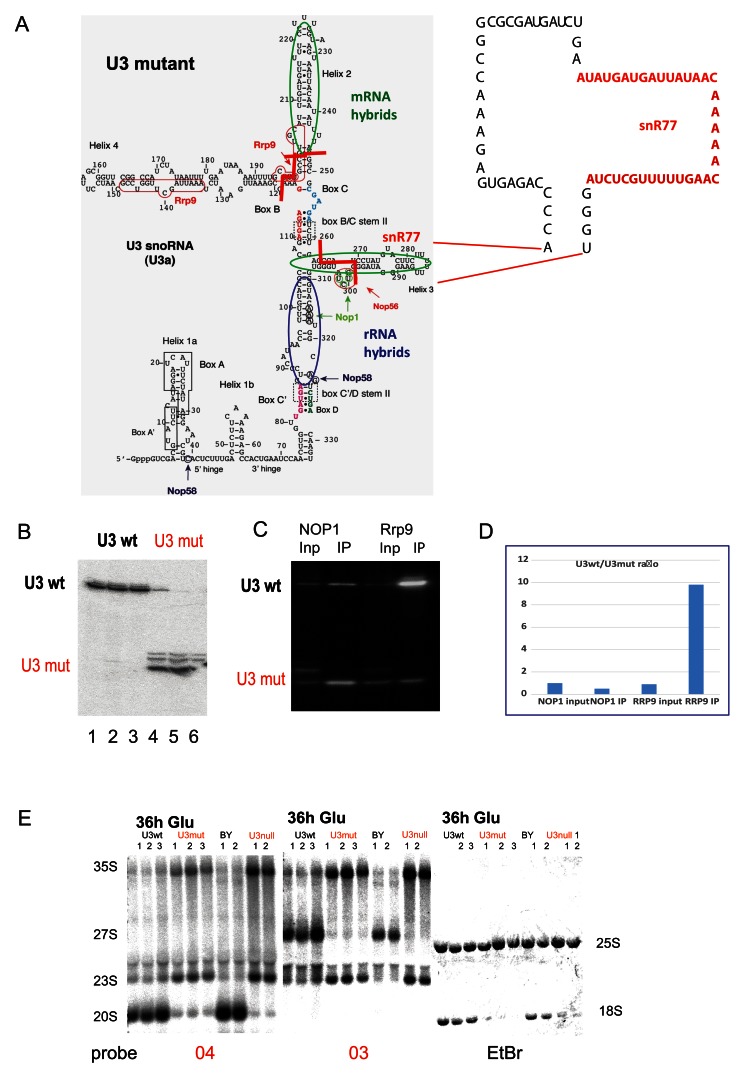
Figure 4. Effects of U3 mutations on pre-rRNA processing.
( A) Left: Predicted structure of U3A. Regions forming hybrids with the rRNA identified by CLASH are circled in blue. Regions forming hybrids with mRNAs are circled in green. End points of deletions are indicated with red lines. Major crosslinking sites for snoRNP proteins are indicated with arrows and nucleotides are circled. Right: Structure of U3 deletion construct. Regions deleted or substituted with the snR77 sequence are indicated with dotted lines. ( B) Northern blot showing expression of the wild type (U3 wt) and the truncated U3 (U3 mut). Lanes 1–3 and 4–6 show biological triplicates. ( C) RNA IP northern blot from the strains expressing either TAP-Nop1 or TAP-Rrp9 and mutant U3. ( D) Quantification of RNA IP. Signal densitometry of the selected lanes were measured with AIDA Image Analyzer v.4.15 densitometry software and plotted. ( E) Northern analysis of pre-rRNA processing following transfer of the U3mutant strain to glucose medium for 36 h. U3 strains have endogenous U3 expression under P GAL control, complemented by plasmid expression of wild type U3 (U3 wt lane) or the truncated mutant (U3mut lanes). As controls, the parental strain (BY) and the non-complemented (U3null lanes) strains are shown. Lanes 1–3 or 1 and 2 for each sample show biological replicates. Site A2 is the 3’ end of the 20S pre-rRNA and the 5’ end of 27SA and 27SB pre-rRNAs. Probe 03 is located in the ITS1 region of the pre-rRNA, 3’ to cleavage site A2. Probe 04 is located in the ITS1 region 5’ to site A2.

