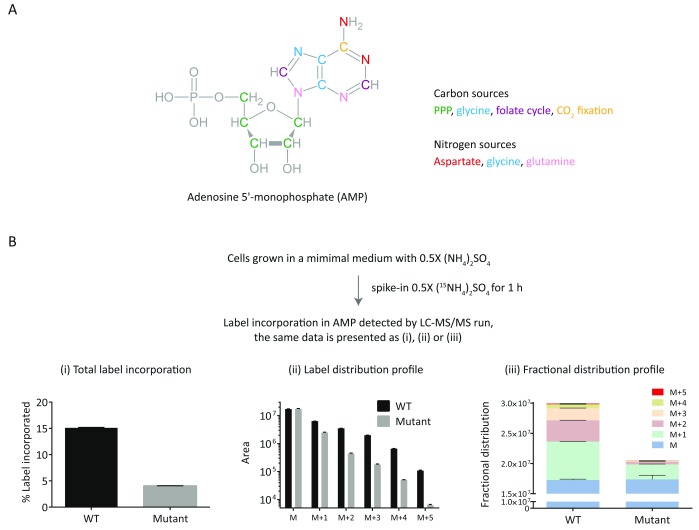
Figure 4. Different ways of presenting and analyzing stable-isotope label incorporation data for complex metabolites.
( A) The structure of AMP is shown along with the pathway-source of individual carbon and nitrogen atoms. The labeling of this metabolite would involve multiple inputs from the respective pathways. ( B) The label incorporation from 15N-ammonium sulfate into AMP was followed as indicated. The obtained data is presented in different formats (i, ii and iii). “M” represents the unlabeled metabolite and M+(1 to 5) indicate label accumulation of 1 to 5 15N atoms in the metabolite. The MS parameters used for label detection are given in Table 2.

