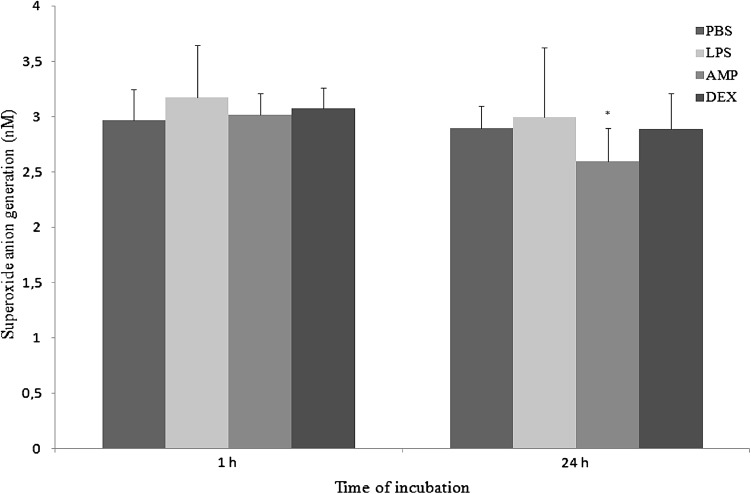
Fig. 10.
The effect of PBS, LPS, AMP or DEX on generation of superoxide anion by neutrophils after 1 h and 24 h of culture. Each bar represents the mean of six rabbits in duplicate measurements and error bars represent the ±SE from the mean. P-values calculated for LPS, AMP, and DEX groups were compared with Student t-test to unstimulated cultures (PBS) and were <0.05. The data are representative of six rabbits in duplicate experiment

