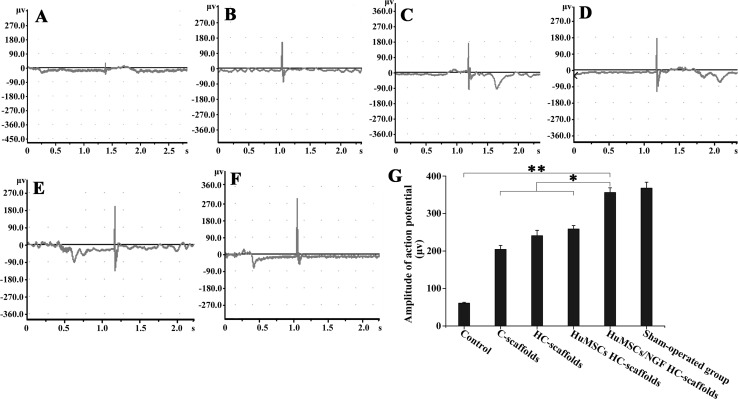
Fig. 6.
Electromyograms of the RLNs after treatment for 8 weeks with nothing A, C-scaffolds B, HC-scaffolds C, HuMSCs HC-scaffolds D and HuMSCs/NGF HC-scaffolds E. Graph F is the electromyogram of sham-operated group and graph G represents the amplitudes (peak-to-peak value) of action potential of various groups (One-way ANVOA, *p < 0.05; **p < 0.01, significantly different between each other)

