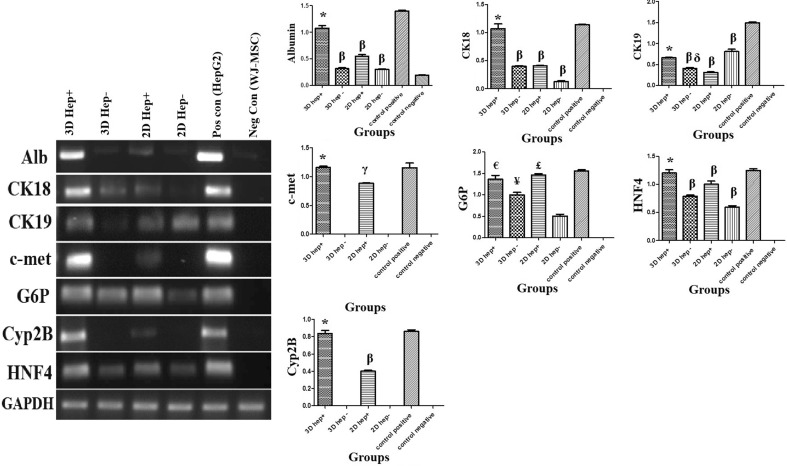
Fig. 6.
RT-PCR shows the liver–specific marker expression by the cells in various conditions. The best microenvironment for cells to express liver specific markers was 3D heparinized condition. Semi-quantifications of the RT-PCR products of each liver-specific marker were depicted in the graphs. HepG2 cell line was used as positive control and undifferentiated Wharton’s jelly mesenchymal stem cells were used as negative control. * Significant difference with non-heparinized scaffold, gel, heparinized gel and negative control (undifferentiated WJ-MSCs) (p < 0.05); β Significant difference with both negative (undifferentiated WJ-MSCs) and positive controls (HepG2 cells) (p < 0.05); δ Significant difference with non-heparinized gel (p < 0.05); γ Significant difference with non-heparinized scaffold, gel, negative (undifferentiated WJ-MSCs) and positive controls (HepG2 cells) (p < 0.05); € Significant difference with non-heparinized scaffold, gel and negative control (undifferentiated WJ-MSCs) (p < 0.05); ¥ Significant difference with non-heparinized gel, negative (undifferentiated WJ-MSCs) and positive controls (HepG2 cells) (p < 0.05); £ Significant difference with non-heparinized gel and negative control (undifferentiated WJ-MSCs) (p < 0.05)

