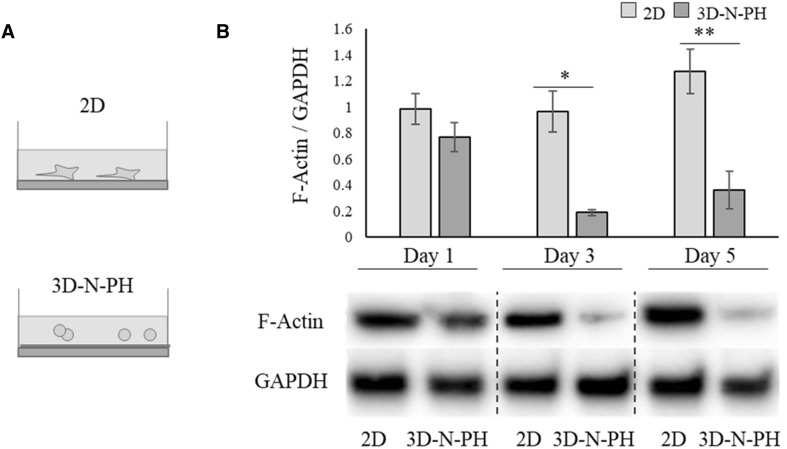
Fig. 5.
The effect of cell morphology on F-actin expression in hBM-MSCs. A Schematic illustration of the experimental groups. hBM-MSCs were cultured in 2D or 3D-N-PH as in Fig. 4. B Protein levels of F-actin were examined in 2D-MSCs or 3D-N-PH-MSCs at 1, 3, and 5 days of culture. The bar graph shows the semi-quantitative analysis of the F-actin protein normalized to the level of GAPDH. Data are presented as the mean and SD from three independent experiments. *p < 0.05 and **p < 0.01 by t test. *** 3D: three-dimensional, hBM-MSCs: human bone marrow-mesenchymal stem cells, 2D: two-dimensional, 3D-N-PH: 3D spheroids formed by the poly-HEMA coating method with a normal cell density, GAPDH: glyceraldehyde-3-phosphate dehydrogenase

