Fig. 6.
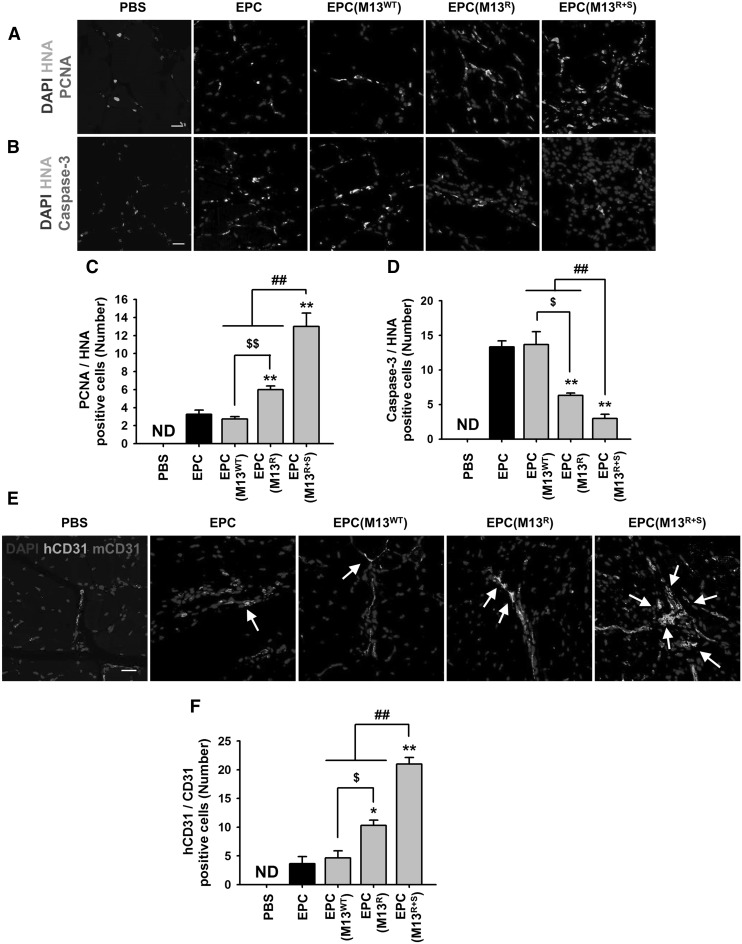
Effect of the engineered M13 nanophage on the proliferation, incorporation, and endothelial differentiation of the transplanted EPCs at the ischemic sites. At 3 days post-operation, the ischemic limb tissues were analyzed to determine the proliferation and survival of the transplanted EPCs treated with the engineered M13 phage at injured sites. A The proliferation of the transplanted cells in the ischemic injured tissues was visualized by immunofluorescent staining for human nuclear antibody (HNA, red) and proliferating cell nuclear antigen (PCNA, green). Scale bar = 20 μm. B The apoptosis of the transplanted cells in the ischemic injured tissues was visualized by immunofluorescent staining for human nuclear antibody (HNA, red) and cleaved caspase-3 (caspase-3, green). Scale bar = 20 μm. C The number of proliferating transplanted cells was quantified by counting the number of PCNA and HNA double-positive cells per high-power field. Values are expressed as the mean ± SEM. **p < 0.01 versus EPC, $$p < 0.01 versus EPC (M13R), and ##p < 0.01 versus EPC (M13R+S). D The apoptosis in the transplanted cells was quantified by counting the number of cleaved caspase-3 and HNA double-positive cells per high-power field. Values are expressed as the mean ± SEM. **p < 0.01 versus EPC, $p < 0.05 versus EPC (M13R), and ##p < 0.01 versus EPC (M13R+S). E At 28 days post-operation, the ischemic tissues were analyzed to determine the endothelial differentiation of the transplanted EPCs treated with the engineered M13 phage at the injured sites. Endothelial differentiation of the transplanted EPCs was visualized by immunofluorescent staining for human-specific CD31 antibody (hCD31, red) and mouse-specific CD31 antibody (mCD31, green). The arrows indicate endothelial differentiation of the transplanted EPCs at the injured tissues. Scale bar = 20 μm. F The number of endothelial differentiated cells was quantified by counting the number of hCD31 and mCD31 double-positive cells per high-power field. Values are expressed as the mean ± SEM. *p < 0.05, **p < 0.01 versus EPC, $p < 0.01 versus EPC (M13R), and ##p < 0.01 versus EPC (M13R+S). (Color figure online)

