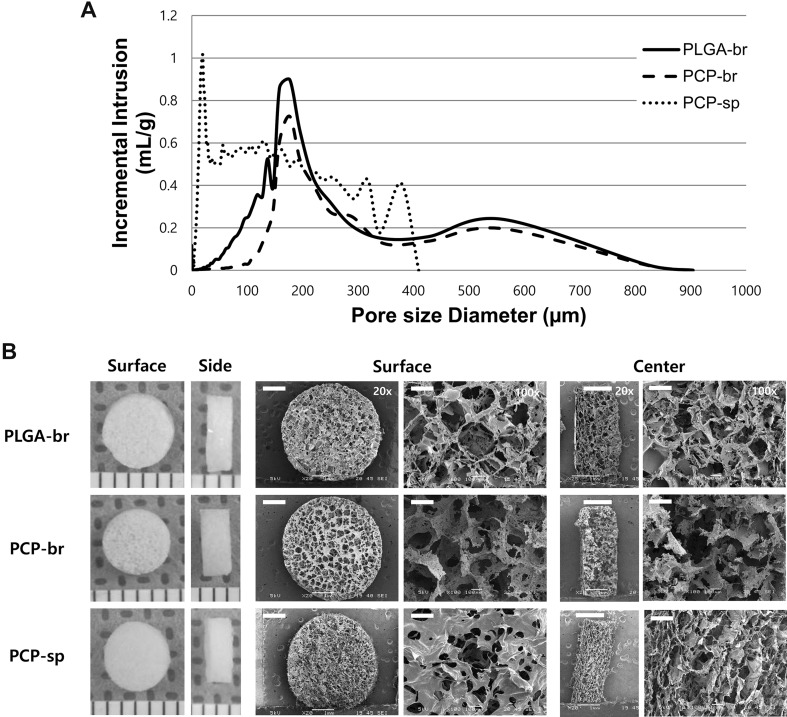
Fig. 4.
Pore structure analysis of PLGA-br, PCP-br, and PCP-sp scaffolds. A Pore size distribution. B Pore morphology (L: gross morphology, R: SEM photomicrographs of the scaffolds; surface, horizontal and vertical cross-section of central areas of scaffolds) of PLGA-br, PCP-br, and PCP-sp scaffolds. Scale unit in gross morphology: mm. Scale bars in SEM images = 1 mm for ×20 and 100 µm for ×100

