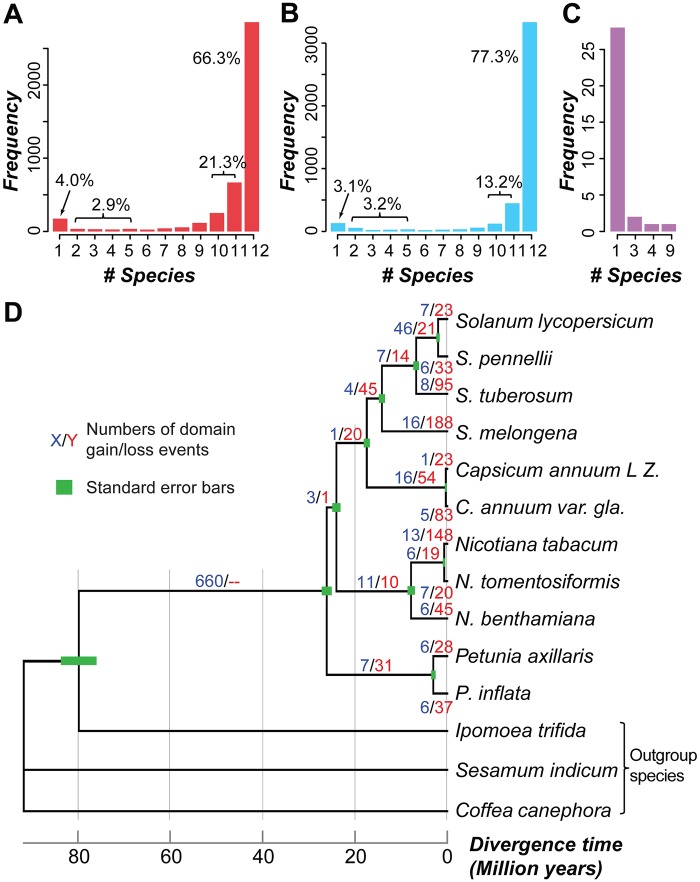
Fig. 1.
—Distribution of domain families and domain family gains/losses in Solanaceae species. Frequency of domain families present in (A) the annotated genomic regions and (B) the annotated plus intergenic regions of different numbers of Solanaceae species. (C) The number of N. sylvestris-specific domain families (defined based on searches of annotated regions) present in intergenic regions of different numbers of Solanaceae species. (D) Inferred numbers of domain family gain/loss events across Solanaceae lineages. Blue/red numbers: the number of domain family gains and losses, respectively. Green bars: standard errors for divergence time estimates.

