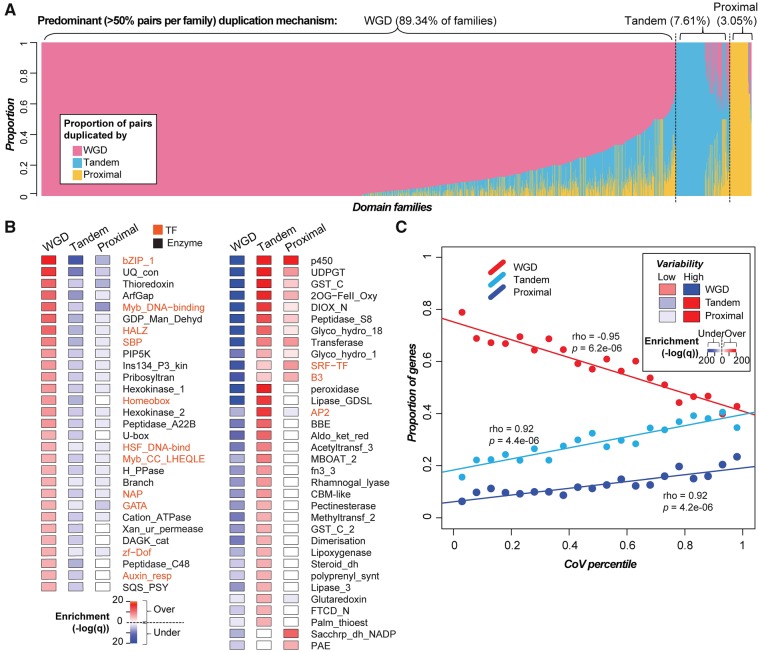
Fig. 5.
—Contribution of duplication mechanism to domain family size variation in 11 Solanaceae species. (A) Proportion of duplicate pairs in each domain family (x-axis) that were predominantly duplicated by WGD, tandem, or proximal mechanisms. (B) Enrichment of members of DNA-binding transcription factor (orange) and enzyme (black) domain families that were duplicated via different mechanisms (the full list of domains and their associated statistics are available in supplementary table S11, Supplementary Material online). Left panel: Domain families that tend to be enriched in WGD duplicates. Right panel: Families that tend to be enriched in tandem/proximal duplicates. (C) Correlation between domain family size variability (represented by CoV percentile) and the proportion of genes duplicated by different duplication mechanisms. The insert shows the enrichment of genes in high- and low-variability domain families duplicated via different mechanisms, tested using Fisher’s exact test. Color scale: −log10 (q). Red and blue: Over- and under-representation, respectively.

