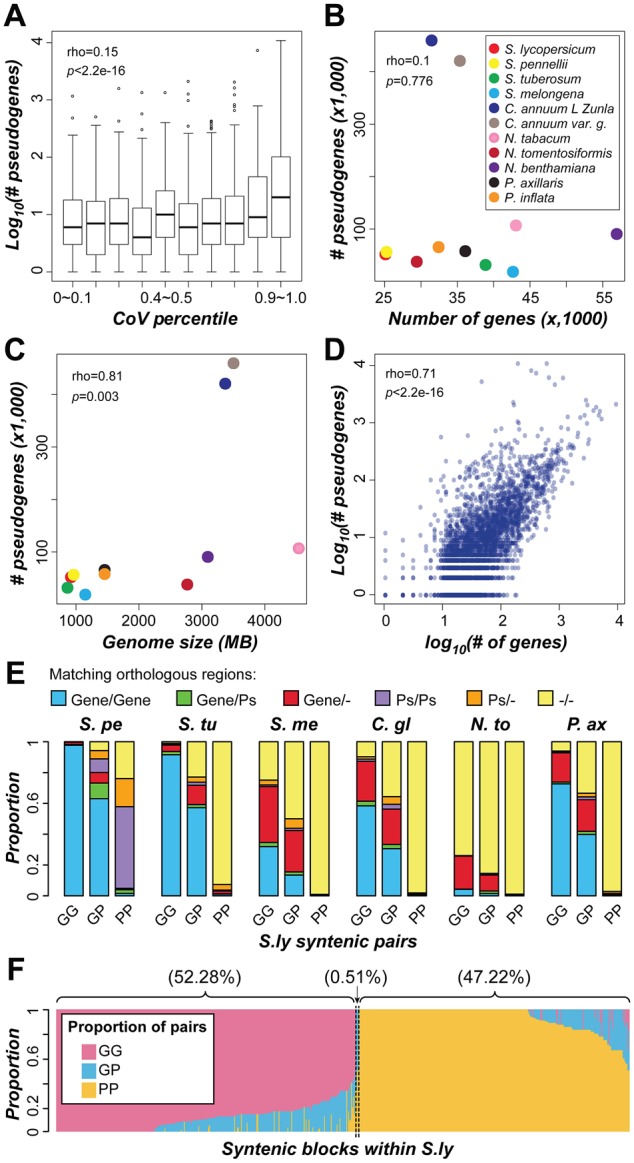
Fig. 7.

—Contribution of pseudogenization to domain family size variation. (A) Relationship between domain family size variability (CoV percentile) and logarithmic number of pseudogenes. (B) Relationship between the number of genes and pseudogenes among Solanaceae species. (C) Correlation between genome size and number of pseudogenes. (D) Correlation between the logarithmic number of genes and pseudogenes in a domain family. Each dot indicates a domain family. The ρ and P value for Spearman’s rank correlation are shown. (E) Proportion of different S. lycopersicum (S.ly) syntenic duplicate pairs that have orthologous sequences in collinear regions in other species. The orthologous sequences were defined giving priority to protein-coding genes over pseudogenes. If orthologous protein-coding genes were not identified for a given gene, then orthologous pseudogenes were searched for. S.pe, S. pennellii; S.tu, S. tuberosum; S.me, S. melongena; C.gl, C. annuum_var. glabriusculum; N.to, N. tomentosiformis; P.ax, P. axillaris; Ps, pseudogene; “–”, no orthologous sequence was found. (F) Proportion of duplicate pairs in S. lycopersicum collinear blocks that are predominantly (>50%) GG, GP, or PP pairs. Each column represents a pair of collinear blocks within S. lycopersicum. GG, gene–gene pair; GP, gene–pseudogene pair; PP, pseudogene–pseudogene pair.
