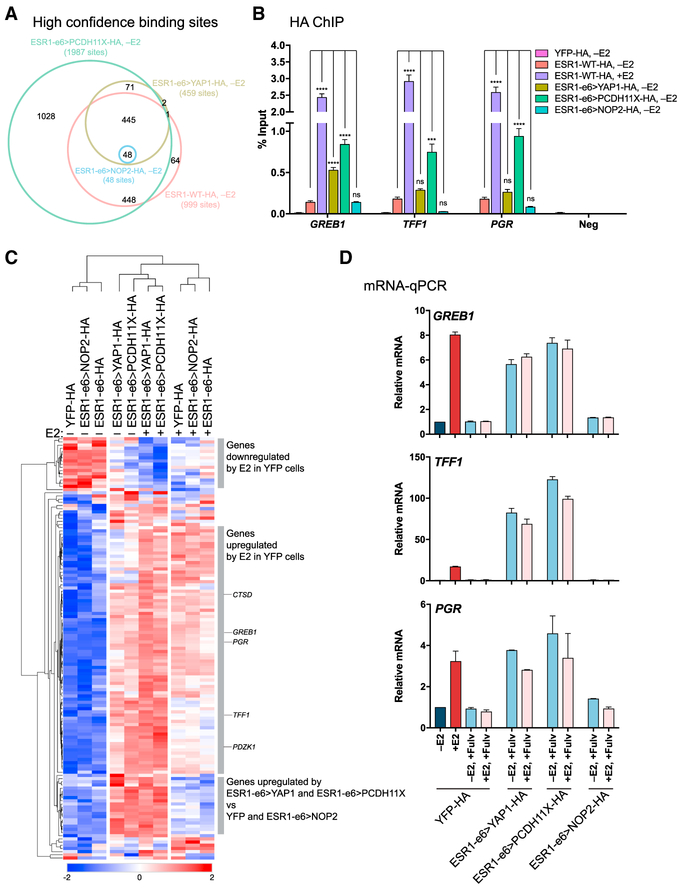
Figure 3. Active ESR1 Fusions Promote Estrogen-Independent Expression of Target Genes.
(A) Venn diagram depicting overlap of binding sites from hormone-deprived stable T47D cells expressing HA-tagged ESR1 constructs identified by HA-ChIP-seq.
(B) HA-ChIP followed by qPCR for ER-binding regions of ER-responsive genes and negative ER-binding region. Bar graphs show average values from three experiments ± SEM. Asterisks denote significant differences as described in STAR Methods.
(C) Heatmap showing differentially expressed genes near 445 sites bound by ESR1-e6>YAP1, ESR1-e6>PCDH11X, and ESR1-WT identified in (A). Known ER-responsive genes are indicated (CTSD, GREB1, PGR, TFF1, and PDZK1). Scale bar indicates row Z score.
(D) Bar graphs depicting relative fold changes of estrogen-responsive genes whose ER-binding regions were examined in (B) from hormone-deprived stable T47D cells, normalized to YFP −E2 (dark blue bar), after E2 addition (+E2, red bar), or in combination with fulvestrant (light blue and pink bars). −E2 and +E2 for ESR1 fusion-expressing cells have been omitted for clarity; see Figure S3F for complete data. Data are shown as averages from two independent experiments ± SEM.
See also Figure S3.

