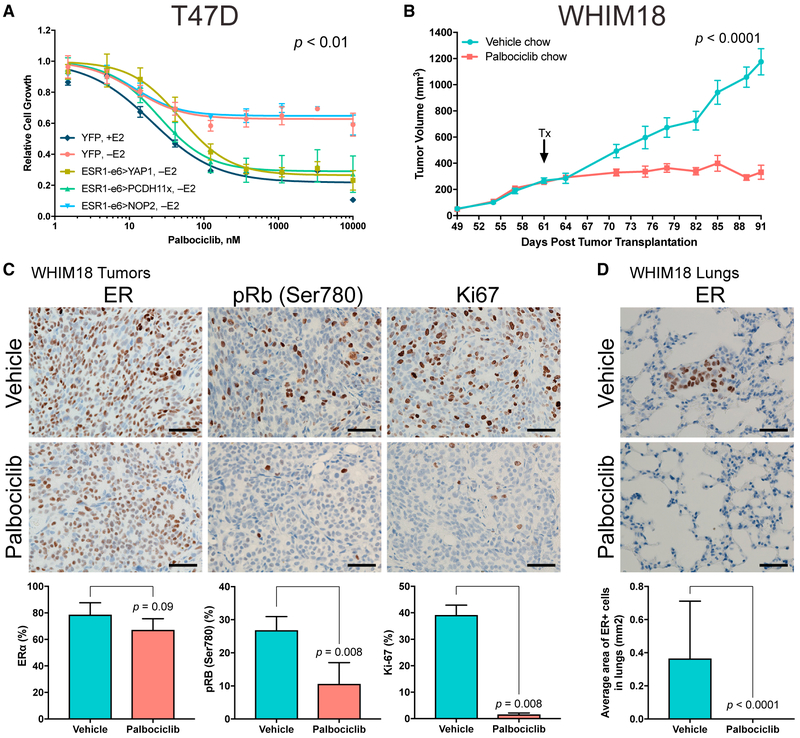
Figure 5. Growth Driven by ESR1 Fusions Can Be Suppressed with CDK4/6 Inhibitor Treatment.
(A) Growth of hormone-deprived stable T47D cells in response to increasing concentrations of a CDK4/6 inhibitor, palbociclib. YFP +E2 used as control. P value describes significance between YFP +E2, ESR1-e6>YAP1, and ESR1-e6>PCDH11x slopes compared with YFP −E2. Data shown are averages of three independent experiments ± SEM.
(B) Tumor volumes of WHIM18 PDX in the absence of exogenous E2 supplementation. Arrow indicates treatment start (Tx) with vehicle or palbociclib containing chow. P value describes significance of tumor growth rates (slopes) derived from tumor volumes at day of randomization to experiment end. Data are shown as averages from 8–11 mice per treatment group ± SEM.
(C) Representative IHC images for ER, pRb, and Ki-67 from vehicle and palbociclib-treated WHIM18 tumors. Quantification of IHC staining below with significance comparing treatment groups. Data are averages counts from five tumor sections from each treatment group, with error bars representing SD.
(D) ER IHC images of lungs from WHIM18-bearing mice. Micrometastatic ER+ lesions were quantified by measuring area of ER+ cells. Data are shown as average ER+ areas from five lung sections per treatment group. P value determined as in (C). Scale bar, 100 μm in (C) and (D).
See also Figure S5.

