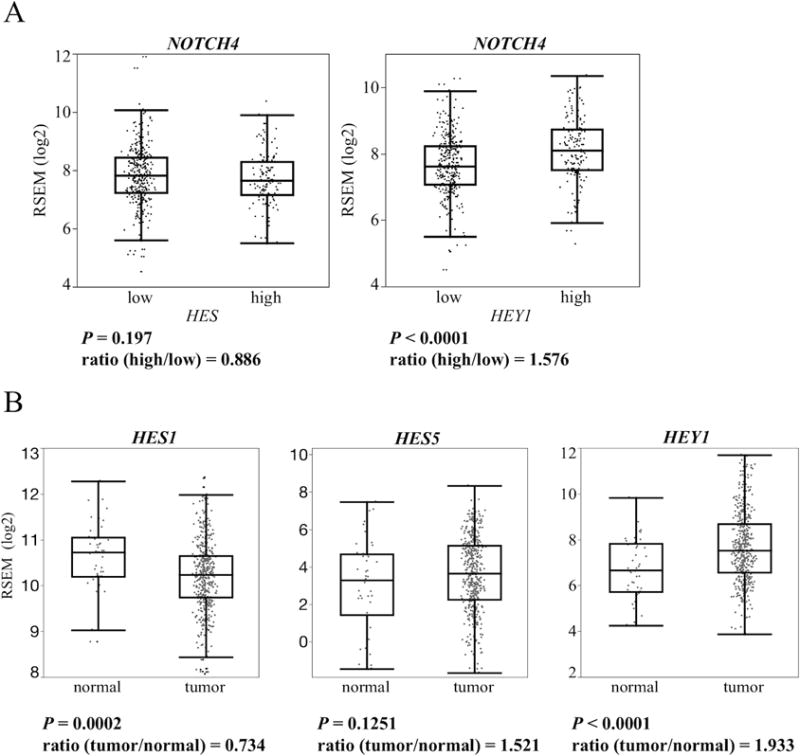
Figure 1. TCGA data set analysis of HES/HEY and NOTCH4 relation.

(A) NOTCH4 expression is compared between the HES (HES1+HES5) and HEY1 high/low group using the TCGA data set. Ratio is calculated by dividing the mRNA expression of the HES or HEY1 high group by that of the low group. (B) HES1, HES5 and HEY1 expression are compared between HNSCC and normal tissue using the TCGA data set. Ratio is calculated by dividing the mRNA expression of the tumor samples by that of the normal samples. Whiskers indicate the minimum and maximum values. P value is calculated by using Student’s t-test.
