
Figure 3. Comparison of EMT-related genes between the NOTCH4 high and low groups using the TCGA data set. Comparison of NOTCH4 expression between sphere and parental cells.
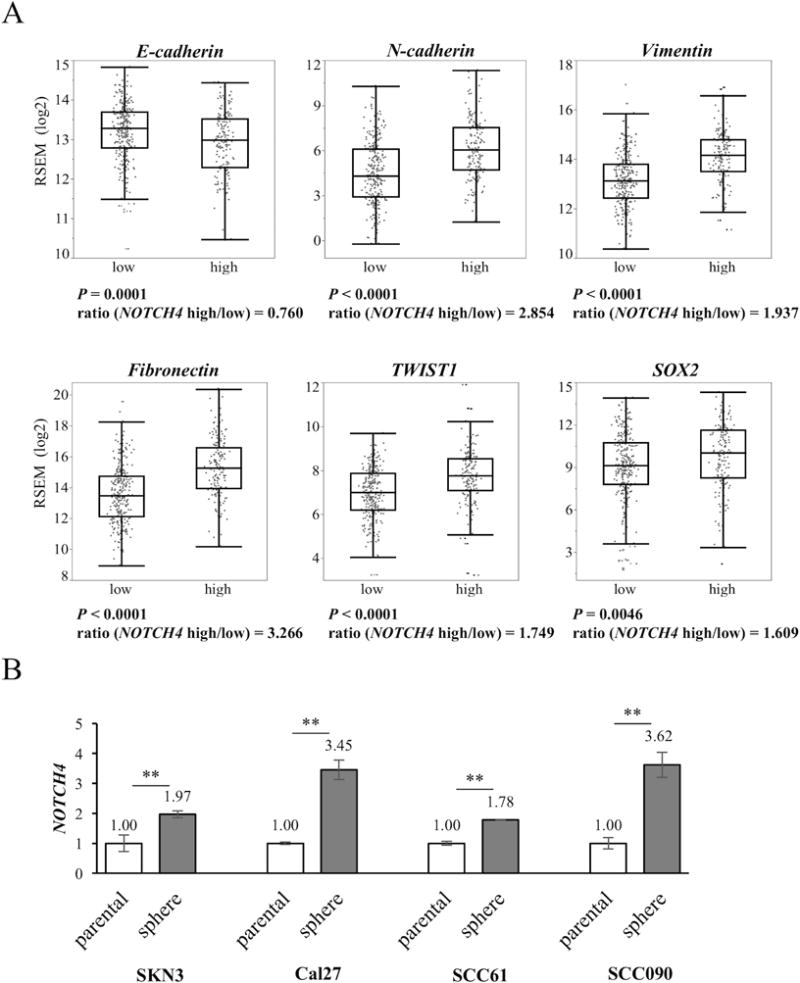
(A) The NOTCH4 high group is defined as tumors with expression 1 standard deviation greater than the mean of normal tissue for NOTCH4. The other tumors are defined as the low group. The boxes represent the interquartile range (25th-75th), and horizontal lines inside the boxes indicate the median. Whiskers indicate the minimum and maximum values. Ratio is calculated by dividing the mRNA expression of the high group by the expression of the low group. (B) NOTCH4 expression is compared between parental and sphere cells using qRT-PCR. P value is calculated by using Student’s t-test. **: P < 0.01.