
Figure 5. HES1/HEY1 expression in si-NOTCH4 cells and NOTCH4 expression in si-HEY1 cells.
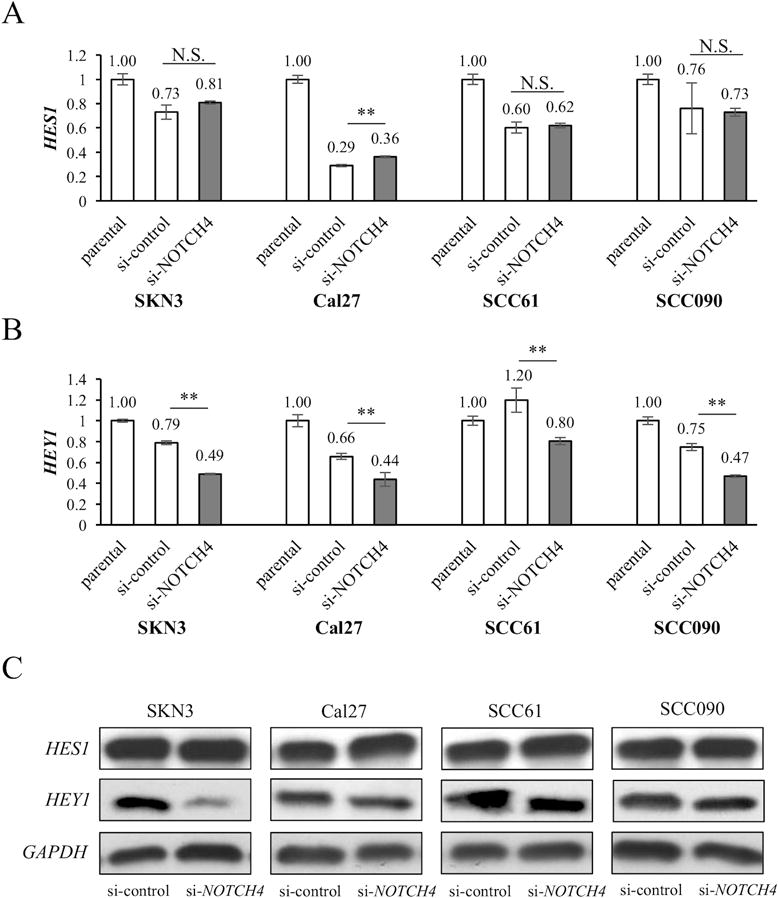
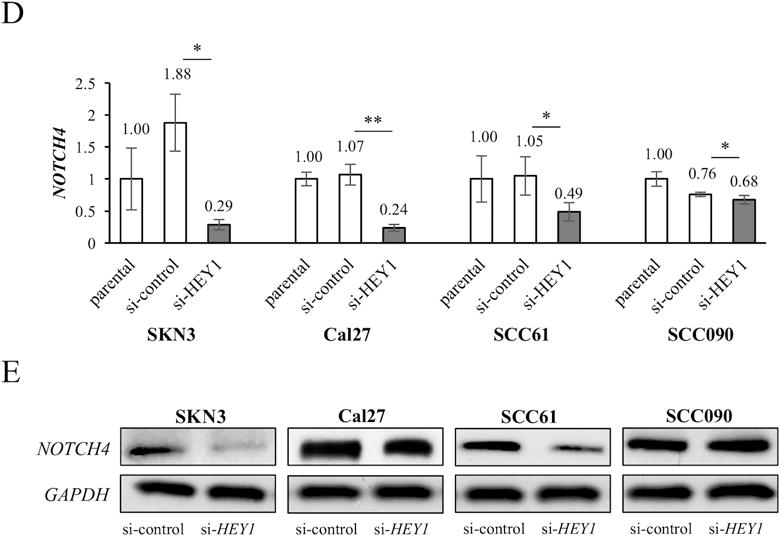
HES1 (A) and HEY1 (B) expression in parental, si-control and si-NOTCH4 cells. mRNA expression is measured by qRT-PCR. The expression differences between si-control and si-NOTCH4 cells are compared. (C) Western blots of HES1 and HEY1 in si-control and si-NOTCH4 cells. (D) NOTCH4 expression of parental, si-control and si-HEY1 cells. mRNA expression is measured by qRT-PCR. The expression differences between si-control and si-HEY1 cells are compared. (E) Western blots of NOTCH4 in si-control and si-HEY1 cells. GAPDH antibody is used as a control. P value is calculated by using Student’s t-test. *: P < 0.05, **: P < 0.01, N.S.: not significant.