
Figure 6. Comparison of HEY1 and EMT-related genes using TCGA data set. Comparison of HEY1 expression between sphere and parental cells.
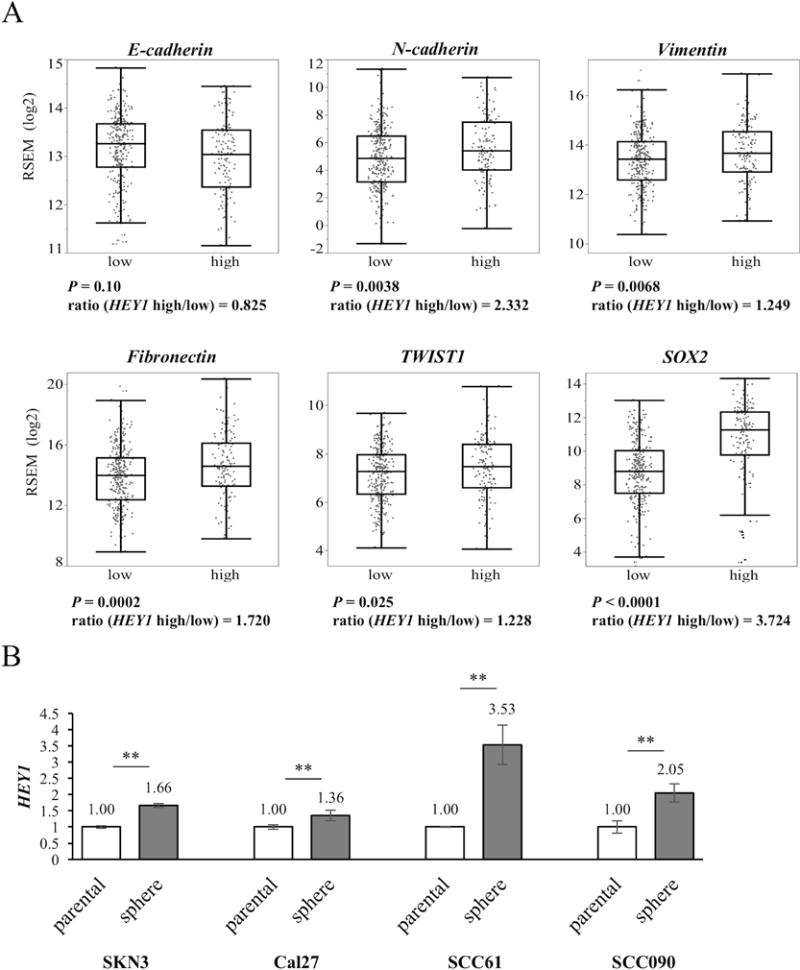
(A) Comparison of EMT-related genes between HEY1 high and low groups using the TCGA data set. The boxes represent the interquartile range (25th-75th), and horizontal lines inside the boxes indicate median. Whiskers indicate the minimum and maximum values. Ratio is calculated by dividing the mRNA expression of the high group by the expression of the low group. (B) HEY1 expression is compared between parental and sphere cells using qRT-PCR. P value is calculated by using Student’s t-test. **: P < 0.01.