
Figure 7. HEY1 relates to EMT gene expression and EMT functions.
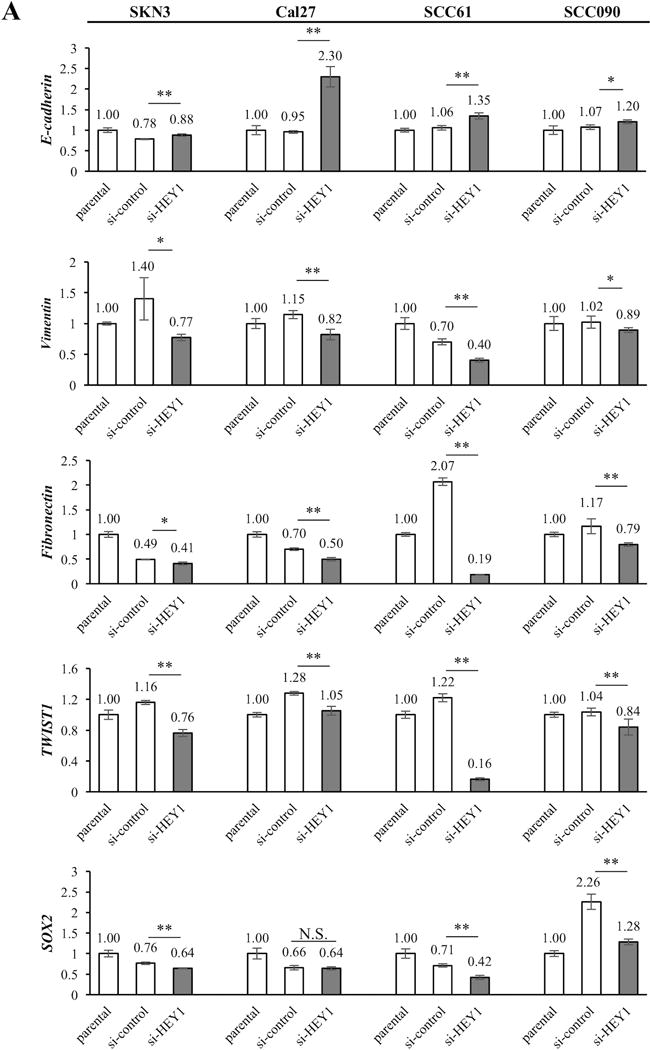
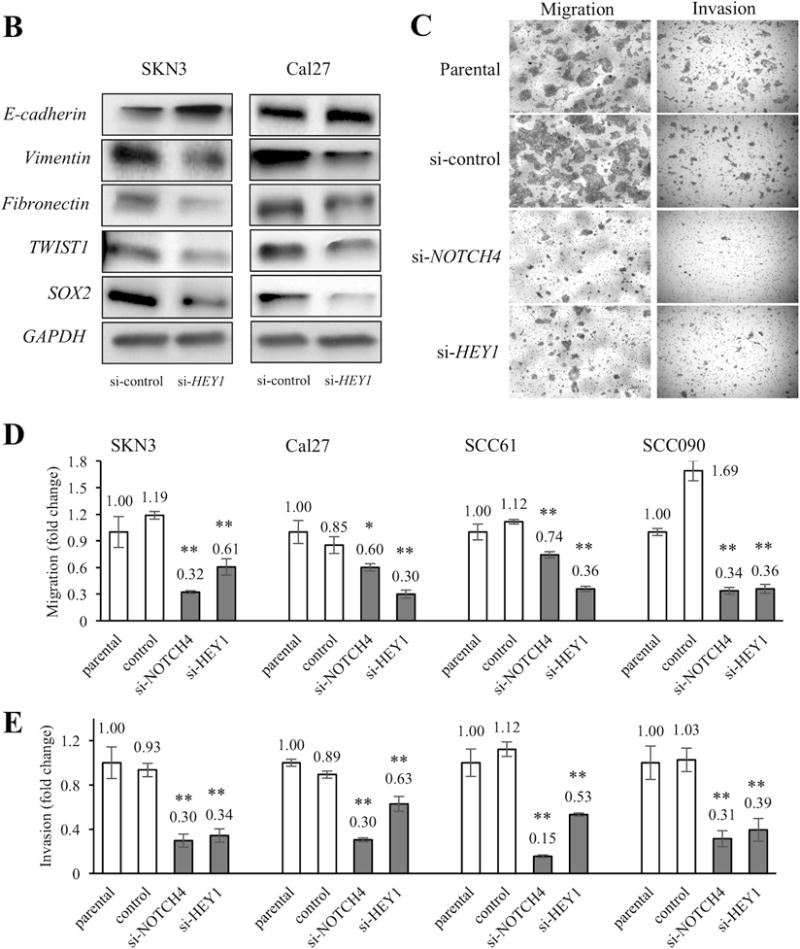
(A) The comparisons of EMT-related gene (E-cadherin, Vimentin, Fibronectin, TWIST1 and SOX2) expressions among parental, si-control and si-HEY1 cells. The expression differences between si-control and si-HEY1 cells are compared. (B) Western blots of EMT-related genes in si-control and si-HEY1 cells. (C) Representative images of migration and invasion assays. The cell line is SCC090. (D, E) Migration and invasion assays in parental, si-control, si-NOTCH4 and si-HEY1 cells. The migration and invasion indexes were calculated by deviding the number of parental cells thorough the chamber. The differences between si-control and si-NOTCH4/si-HEY1 cells are compared. P value is calculated by using Student’s t-test. *: P < 0.05, **: P < 0.01, N.S.: not significant.