FIGURE 2.


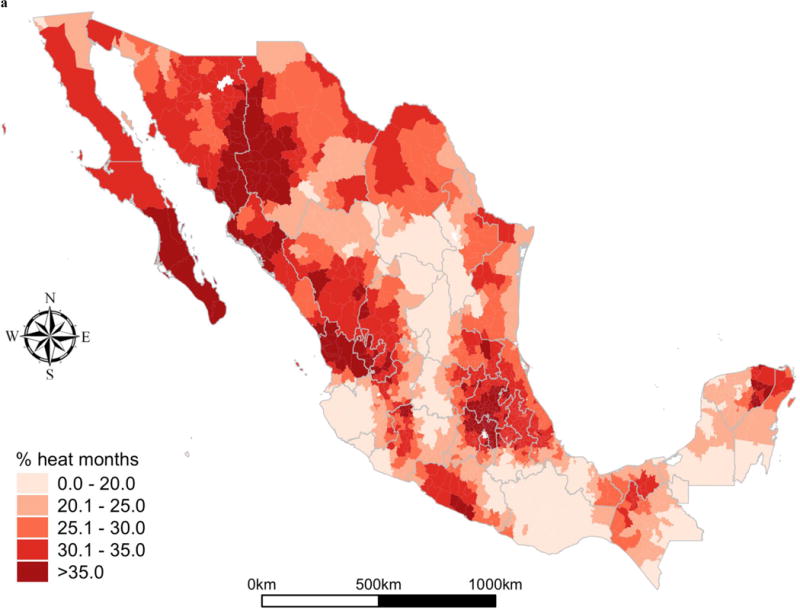
a Percent of months in municipality in 1995‒1999 when temperatures exceeded 1960‒1990 average by 1–1.99 standard deviations
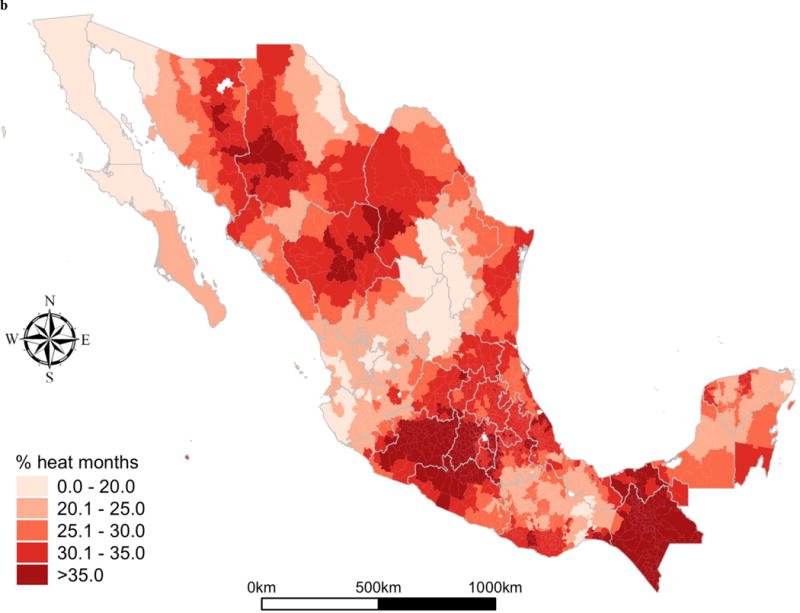
b Percent of months in municipality in 2005‒2009 when temperatures exceeded 1960‒1990 average by 1–1.99 standard deviations
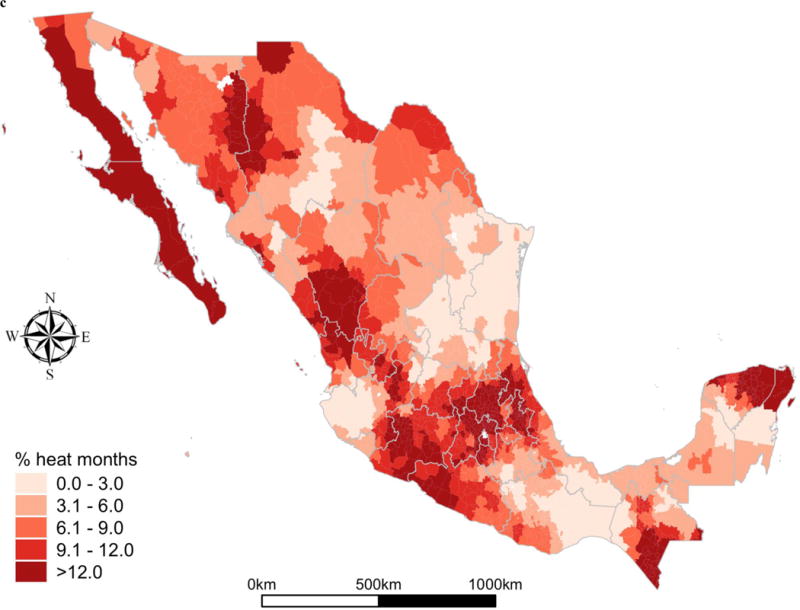
c Percent of months in municipality in 1995‒1999 when temperatures exceeded 1960‒1990 average by 2 or more standard deviations
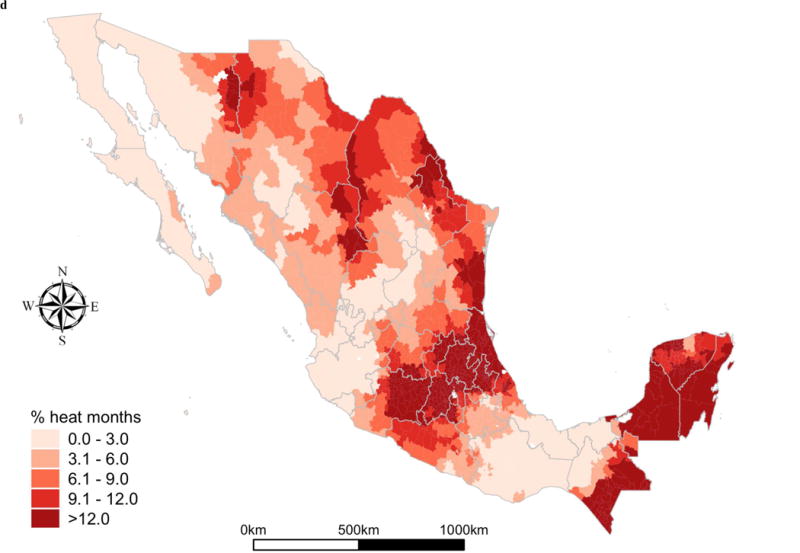
d Percent of months in municipality in 2005‒2009 when temperatures exceeded 1960‒1990 average by 2 or more standard deviations
