FIGURE 6.


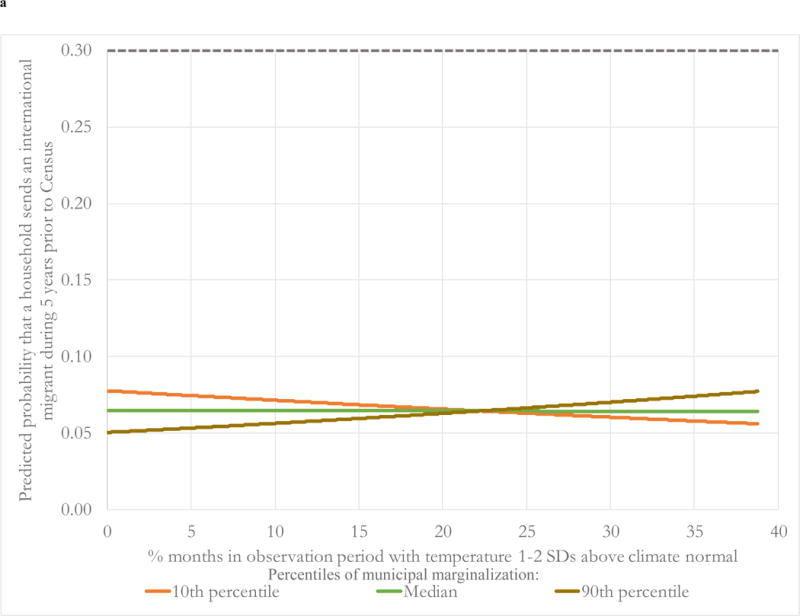
a Predicted probability that a rural Mexican household sends an international migrant according to the frequency of temperature increases (1‒2 SDs above normal) for different levels of municipal marginalization.
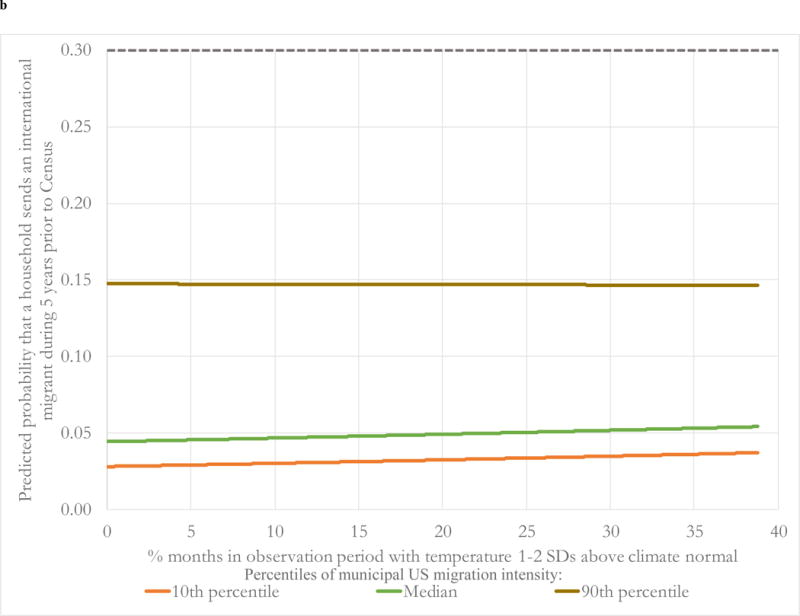
b Predicted probability that a rural Mexican household sends an international migrant according to the frequency of temperature increases (1–2 SDs above normal) for different levels of municipal US migration intensity.
