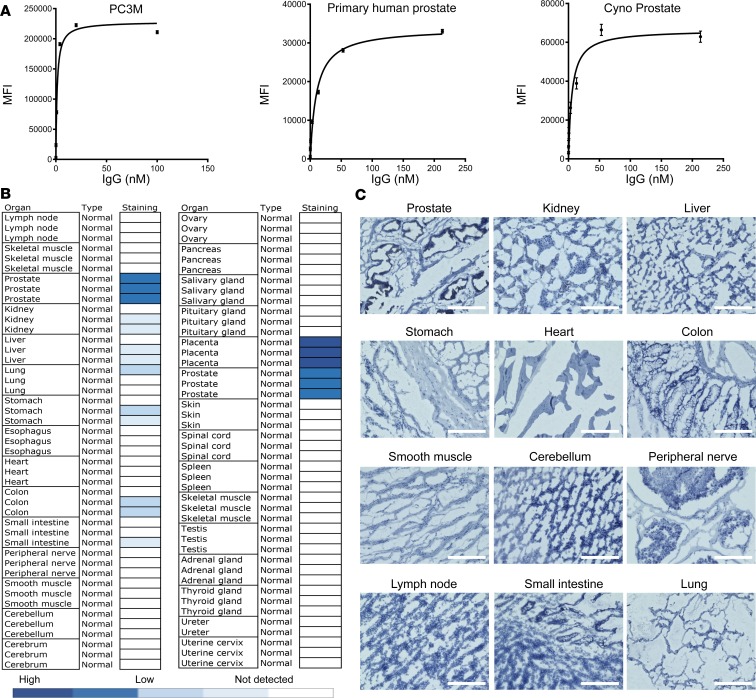
Figure 2. Antibody binding to tumor and normal cells and tissues.
(A) Apparent KD measurement by FACS of YS5 IgG1 on prostate cancer (PC3M, apparent KD = 1.186 ± 0.295 nM), human primary normal prostate epithelial cells (HPrEpC, apparent KD = 9.666 ± 0.738 nM), and primary cynomolgus monkey prostate epithelial cells (Cyno Prostate, apparent KD = 6.748 ± 1.979 nM). (B) IHC staining patterns of YS5 IgG1 on FDA standard human normal tissue panel for therapeutic antibody evaluation. (C) Images of normal tissue staining described in B. H score for prostate epithelium, 173; kidney, 4; liver, 2; colon, 1.5; small intestine, 1.6; stomach, 1.6; and the rest, 0. Scale bars: 200 μm.

