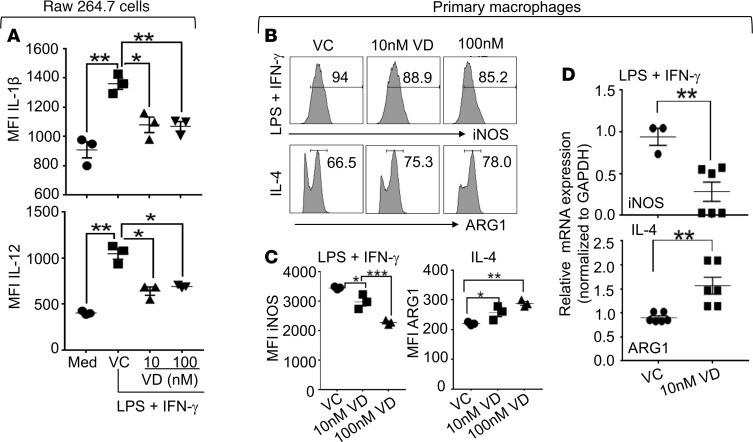
Figure 2. 1,25(OH)2D suppressed M1 macrophage differentiation but augmented M2 macrophage differentiation in vitro.
(A) RAW 264.7 cells were cultured in the absence or presence of LPS and IFN-γ. Additionally, the cultures that contained LPS and IFN-γ were added with vehicle control (VC), 10 nM 1,25(OH)2D (VD), or 100 nM 1,25(OH)2D (VD). Twenty-four hours later, the cells were stimulated with a cell-stimulation cocktail in the presence of a protein transport inhibitor cocktail overnight. The cells were then analyzed for the expressions of IL-1β and IL-12 by FACS. Data show the mean fluorescence intensities (MFIs) of IL-1β and IL-12. (B–D) Primary macrophages were generated from BM. The BM-derived primary macrophages were differentiated into M1 (LPS + IFN-γ) or M2 (IL-4) in the presence of VC, 10 nM 1,25(OH)2D (VD), or 100 nM 1,25(OH)2D (VD). Twenty-four hours later, the cells were stimulated as described in A. After the stimulation, the cells that cultured under the M1 differentiation conditions were analyzed for the expressions of iNOS, and those under the M2 differentiation conditions were analyzed for the expression of arginase 1 (ARG1) by FACS (B and C) and qPCR (D). Representative FACS plots are shown in B; MFIs of iNOS and ARG1 are shown in C; mRNA expressions of iNOS and ARG1 are shown in D. *P < 0.05, **P < 0.01, ***P < 0.001, 2-way ANOVA, n = 3.

