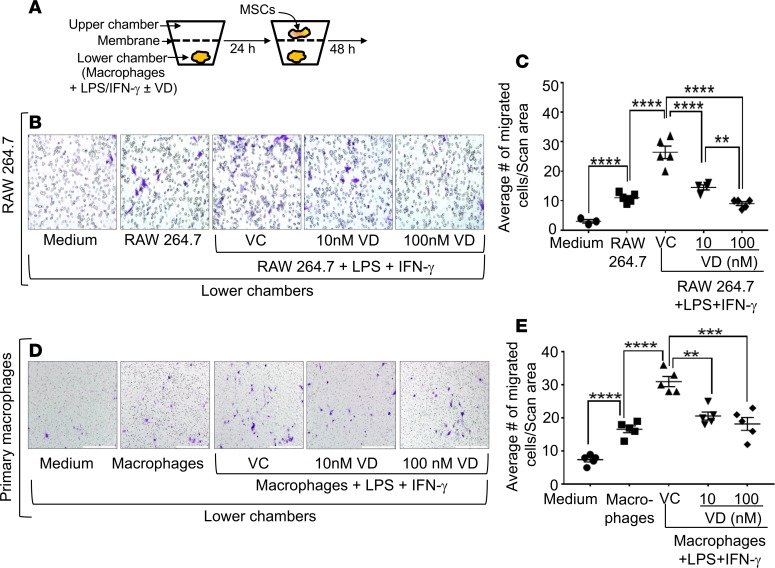
Figure 4. M1 macrophages enhanced the migration of MSCs, which was dose-dependently suppressed by 1,25(OH)2D.
(A) In a transwell culture system, the lower chambers were added with medium, RAW 264.7 cells, or RAW 264.7 cells + LPS + IFN-γ (M1 differentiation condition). Additionally, the wells, which contained RAW 264.7 cells + LPS + IFN-γ, were also added with vehicle control (VC), 10 nM 1,25(OH)2D (10 nM VD), or 100 nM 1,25(OH)2D (100 nM VD). Twenty-four hours later, BM-derived MSCs were added into upper chambers, and the cells were cultured. Twenty-four hours after that, the membranes were stained with crystal blue for the enumeration of migrated MSCs. (B) Representative microscopic images show the migration of MSCs in the membranes. Blue color indicates migrated cells. Magnification, 20×. (C) Cumulative data show migrated MSCs (average number of 3 different microscopic fields). (D and E) The same experiment was performed using BM-derived primary macrophages. Magnification, 10×. **P < 0.01, ***P < 0.001, ****P < 0.0001, ANOVA, n = 3.

