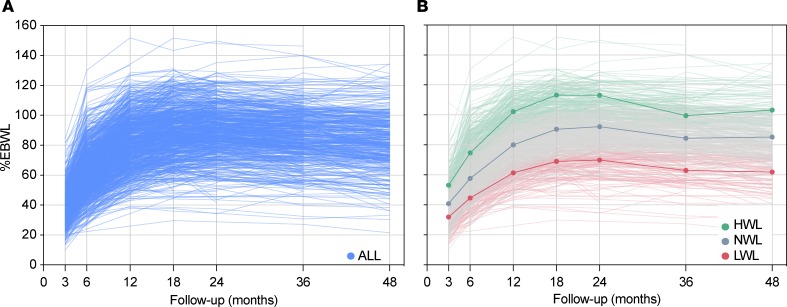
Figure 2. Postsurgery weight loss trajectory analysis.
(A) Spaghetti plot showing the percentage of excess body weight loss (%EBWL) of the 767 bariatric patients studied (ALL) over the first 4 years postsurgery (6, 12, 18, 24, 36, and 48 months). (B) Trajectory groups of %EBWL estimated by latent class growth analysis. Weight loss data from the follow-up period of 48 months were used to create groups depending on %EBWL. The 3 resulting trajectory groups were high weight loss (HWL; green lines), representing 28.2% of subjects; normal weight-loss (NWL, gray lines), composed of 52.7% of subjects; and low weight-loss (LWL, red lines), which encompassed 19.2% of subjects.

