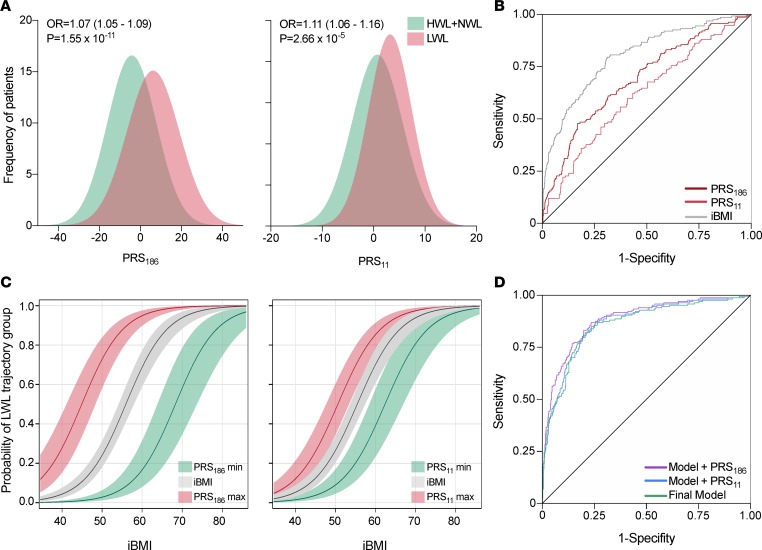
Figure 3. Effect of polygenic risk scores on weight loss trajectory groups.
(A) Histograms displaying the different distribution of polygenic risk scores PRS186 and PRS11 in patients assigned to LWL or HWL+NWL trajectory groups. As shown, increasing values of PRS186 and PRS11 are significantly associated with a greater probability of being in the LWL group. Odds ratios (OR) and P values are for the linear trend test in the multivariable binary logistic model. HWL, NWL, and HWL: high-, normal-, and low-weight-loss trajectory groups. (B) Graphical representation of the area under the ROC curve (AUC) for PRS186 and PRS11. The AUC for initial BMI (iBMI) is also shown. (C) Impact of maximum (red lines) and minimum (green lines) values of PRS186 and PRS11 on the probability of being in the LWL group as a function of iBMI (gray lines). Gray, red, and green shaded areas represent 95% confidence intervals. (D) The AUC of the final logistic prediction models, including all the demographic and clinical predictors before (Final Model: sex, age, type of surgery, and iBMI) and after the inclusion of polygenic risk scores (Model + PRS186 and Model + PRS11) are shown.

