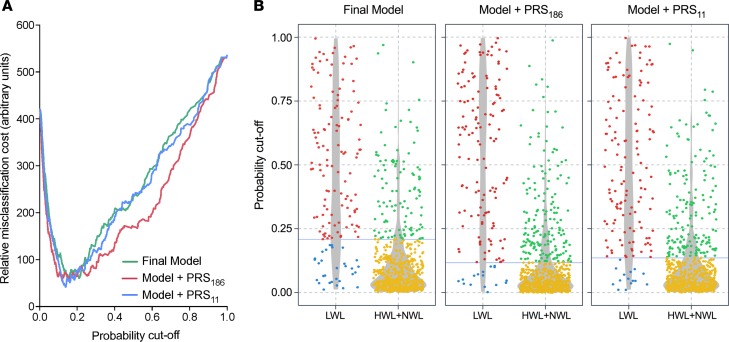
Figure 5. Cost-effectiveness analysis of polygenic risk scores.
(A) Cost curves of the final logistic prediction model including all the demographic and clinical predictors (Final Model: sex, age, type of surgery, and initial BMI), Model + PRS186, and Model + PRS11 are shown. Minimal misclassification cost was obtained by estimating a false negative (FN) decision (actual LWL patients assigned to HWL+NWL group) to be 5 times as costly as a false positive (FP) decision (actual HWL+NWL assigned to LWL group). (B) Confusion matrix of each model showing the different distribution of correctly (true positives, TP, and true negatives, TN) and incorrectly (FN and FP) assigned observations. Blue lines indicate the probability cutoff with minimal misclassification cost for each model (final model = 0.21, model + PRS186 = 0.12, and model + PRS11 = 0.14). Red and blue points represent TN and FN; green and yellow points, TP and FP, respectively. Gray shaded areas are violin plots representing the density of observations across probability cutoffs. HWL, NWL, and LWL: high-, normal-, and low-weight-loss groups.

