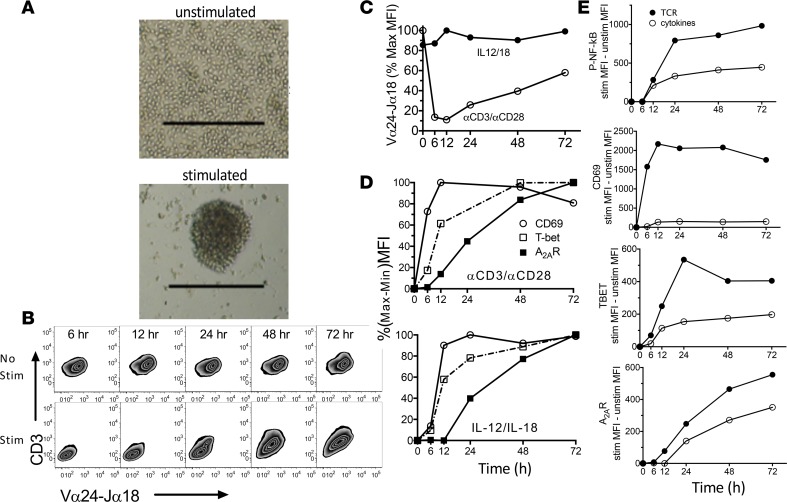
Figure 2. Kinetics of changes in the expression of activation markers following stimulation of cultured human iNKT cells.
(A) Images of cultured human iNKT cells after 29 hours of incubation without stimulation or during stimulation with αCD3 and αCD28 Abs as described in the Methods. Scale bars: 250 μm. (B and C) FACS analysis reveals reduced immunofluorescence of CD3 and the invariant TCR (Vα24-Jα18) over time following iNKT cell stimulation by αCD3/αCD28 (Stim) and lack of change in response to IL-12 and IL-18. (D) Kinetics of changes in CD69, T-bet, and adenosine A2A receptor (A2AR) expression over time in response to αCD3/αCD28 or IL-12/IL-18 normalized to the maximal response of each marker. (E) Absolute changes in phospho-NF-κB p65, CD69, T-bet, and A2AR immunofluorescence over time in response to αCD3/αCD28 (TCR) or IL-12/IL-18 (cytokines).

