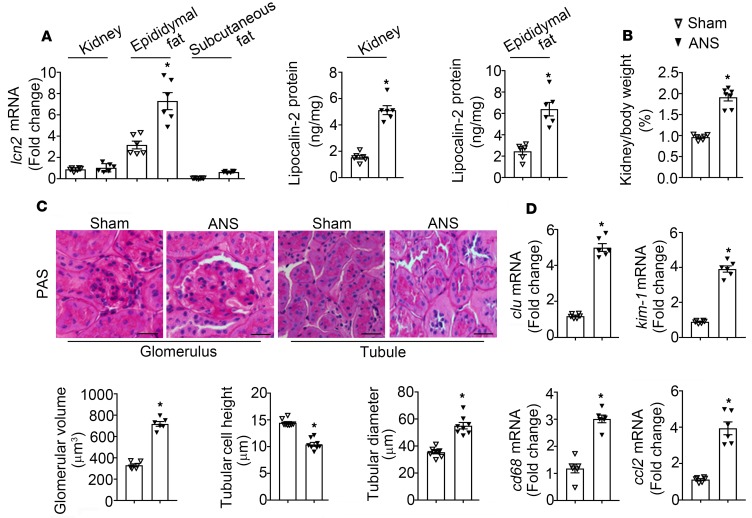
Figure 6. ANS treatment caused chronic renal injuries in mice with selective deletion of lcn2 alleles in kidney.
(A) Wt1CreGFP-LKO mice were subjected to sham or ANS treatment as in Figure 1. Kidney, epididymal, and s.c. adipose tissues were collected after 4-week treatment. qPCR was performed to measure the lcn2 mRNA levels. The results are shown as fold changes against kidney samples of the sham control animals (A, left). ELISA was applied to examine the lipocalin-2 protein contents in kidney and epididymal adipose tissues (A, middle and right). (B) The wet weights of each kidney were recorded and calculated as percentage ratios against body weight for comparison. (C) PAS staining was used to evaluate the glomerular and tubular injuries in kidney of sham- or ANS-treated Wt1CreGFP-LKO mice (C, top). Magnification, 400×. Scale bar: 20 μm. The glomerular area, tubular cell height, and diameter were quantified by ImageJ software as described in Methods (C, bottom). (D) The gene expression levels of injury markers, including clu, kim-1, cd68, and ccl2 were examined by qPCR and presented as fold changes against the sham controls. Data are shown as mean ± SEM; *P < 0.05 vs. sham controls by Mann-Whitney nonparametric Student’s t test (n = 6).

