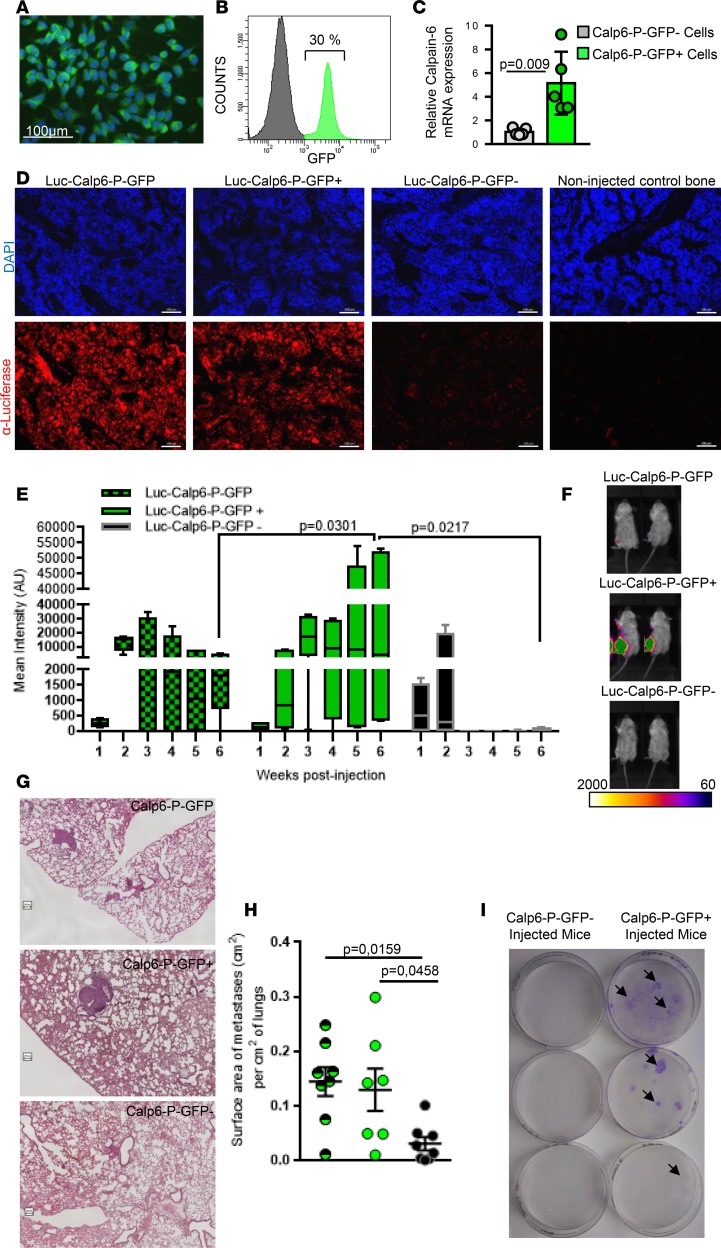
Figure 1. Calpain-6–expressing cells are tumor-initiating cells.
(A) Fluorescence microscopy of Calp6-P-GFP K7M2 cells. (B) Flow cytometry of GFP in Calp6-P-GFP K7M2 cells. (C) RT-qPCR analysis of calpain-6 mRNA expression in sorted Calp6-P-GFP– and -GFP+ K7M2 cells. Data are the mean ± SD from 3 independent RNA extracts compared by 2-tailed Student’s t test. (D) Immunofluorescence of luciferase-expressing cells (tumor cells) in sections of bone injected with unsorted Luc-Calp6-P-GFP or sorted Luc-Calp6-P-GFP+ or -GFP– K7M2 cells. The bones were collected at 6 weeks after implantation. Bone tissues from noninjected mice served as control. Scale bars: 100 μm. (E) Quantification of bioluminescent signals in tibias of Luc-Calp6-P-GFP K7M2–implanted mice during tumor growth. n = 6 mice/group. Data are medians, box edges are the interquartile range, and whiskers are the range. Outliers were identified by Grubbs’ test (α = 0.05). Data were compared by 2-way ANOVA. (F) Typical images of the bioluminescent signals in tibias of K7M2-implanted mice. (G) Representative H&E-stained lung sections from mice implanted for 6 weeks with unsorted Calp6-P-GFP or sorted Calp6-P-GFP– or -GFP+ K7M2 cells. Scale bars: 100 μm. (H) Metastasis area. n = 7 mice (unsorted Calp6-P-GFP K7M2 cells), n = 7–8 mice (sorted Calp6-P-GFP– or -GFP+ K7M2 cells). Data are the mean ± SD compared by 1-way ANOVA. (I) Crystal violet staining of K7M2 cells in lung cell cultures. Each well was seeded with lung cells from a K7M2 bone–implanted mouse. Arrows indicate cell clones.

