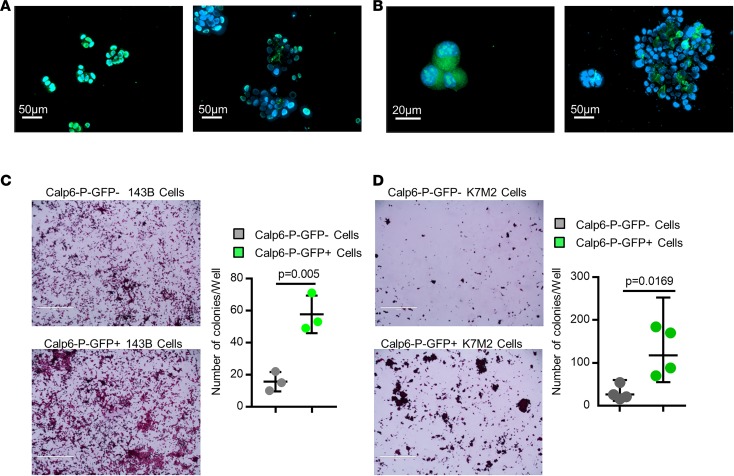
Figure 3. Calpain-6 expression is associated with stem cell features.
(A and B) Fluorescence microscopy of GFP in little spheres (left panel) and large spheres (right panel) of 143B cells (A) and K7M2 cells (B). (C and D) Stem-cell colony-formation assays with 143B cells (C) and K7M2 cells (D). Data are the mean ± SD from 3 independent cultures of 143B cells and 4 independent cultures of K7M2 cells compared by 2-tailed Student’s t test. Scale bars: 1,000 μm.

