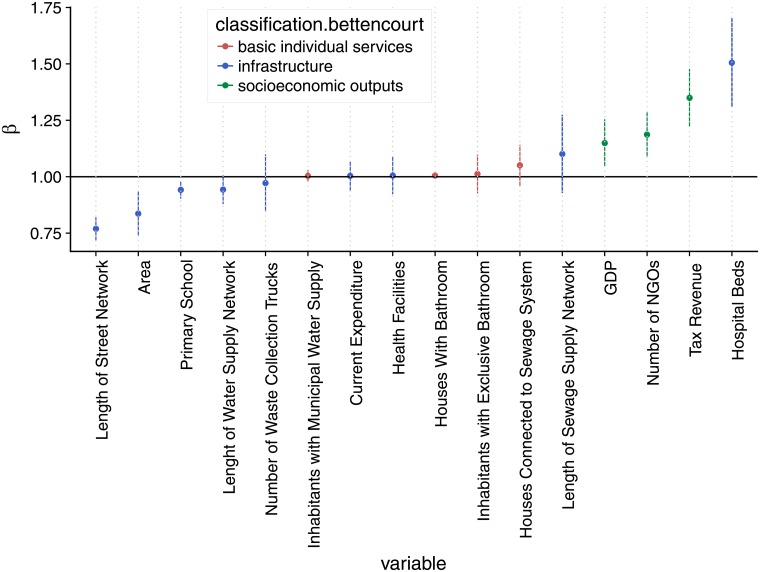
Fig 4. Exponents values for different urban indicators in the Brazilian urban system.
Each dot represents the scaling exponent related to the best-fit line from the OLS regression of the population against the studied variable; vertical line segments represent 95% confidence interval (CI) of those regressions; colors are based on Bettencourt’s classification; the horizontal black line indicates linear relationship.

