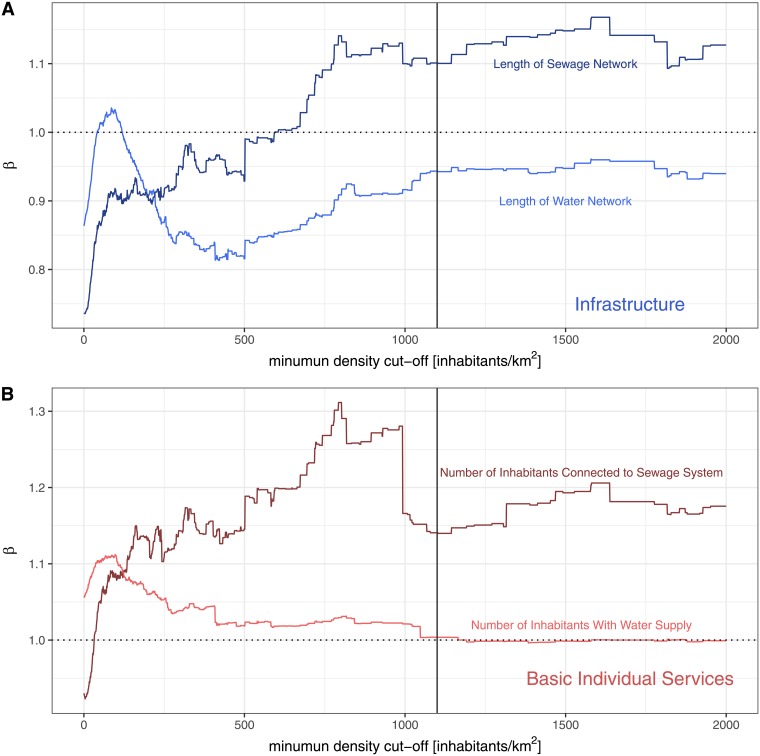
Fig 5. Scaling exponent β as a function of minimum density cut-off for selected variables.
Each line represents the scaling exponent (y-axis) from OLS regressions of the log-transformed data of each variable as a function of the minimum density cut-off (x-axis). A: Infrastructural Variables; B: Basic Individual Services.

