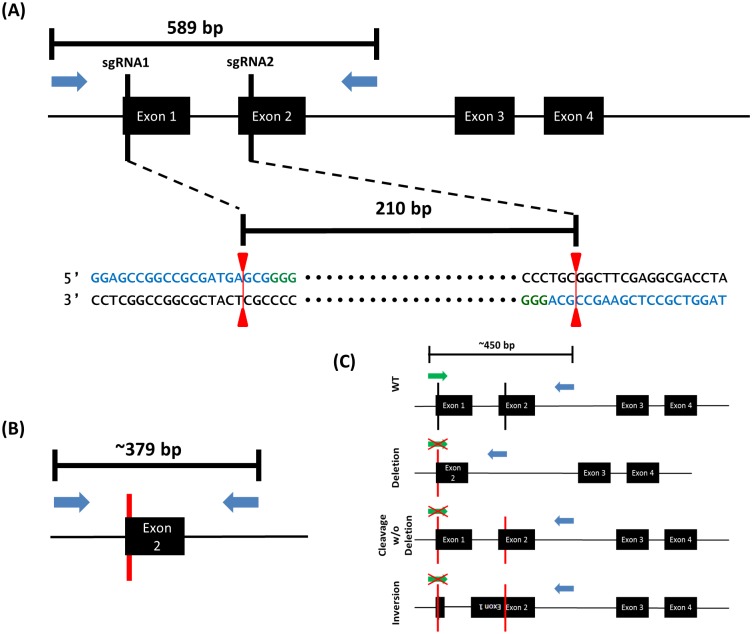
Fig 2. MIEN1 Deletion and Indel PCR reactions.
(A) MIEN1 deletion schematic. Blue arrows represent location of primers for deletion PCR reaction. Blue sequences are sgRNA sequences. Green sequences are PAM sequences. Red line indicates approximate cleavage location to yield 210bp deletion. (B) Genomic deletion of MIEN1 exon 1. PCR product result following deletion of sequence between sgRNA1 and sgRNA2. (C) Indel PCR diagram. CRISPR cleavage scenarios other than deletion are outlined. The PCR primer which lies across the sgRNA1 target site is sensitive to indels which occur during cleavage without deletion or inversion. Absence of band in indel reaction indicates presence of indel. Green arrow indicates sgRNA1 Oligo1 which acts as the forward primer. Blue arrow is the same reverse primer from the deletion reaction. Red vertical lines are indels. Red ‘X’ indicates an inability for the forward primer to anneal.

