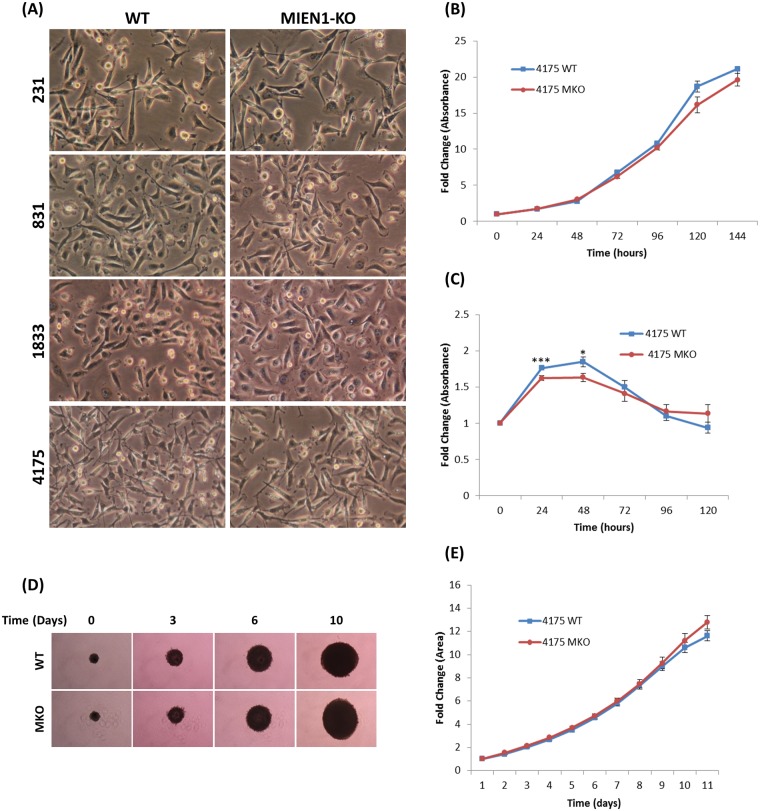
Fig 5. MIEN1 knockout cell characterization.
(A) Cell morphology. Representative 10x magnification phase contrast images of MIEN1 KO cells and corresponding parental cells. (B) MTT assay comparing fold change of proliferation of 4175-WT and 4175-MKO cells. (C) MTT assay comparing fold change of cell survival during serum deprivation of 4175-WT and 4175-MKO cells. (*p-value <0.05. ***p-value <0.005) (D) Spheroid formation. Representative 4x magnification phase contrast images of spheroid growth in Matrigel for 4175-WT and 4175-MKO cells. (E) Quantification of fold change of area of spheroids. Error bars are standard error.

