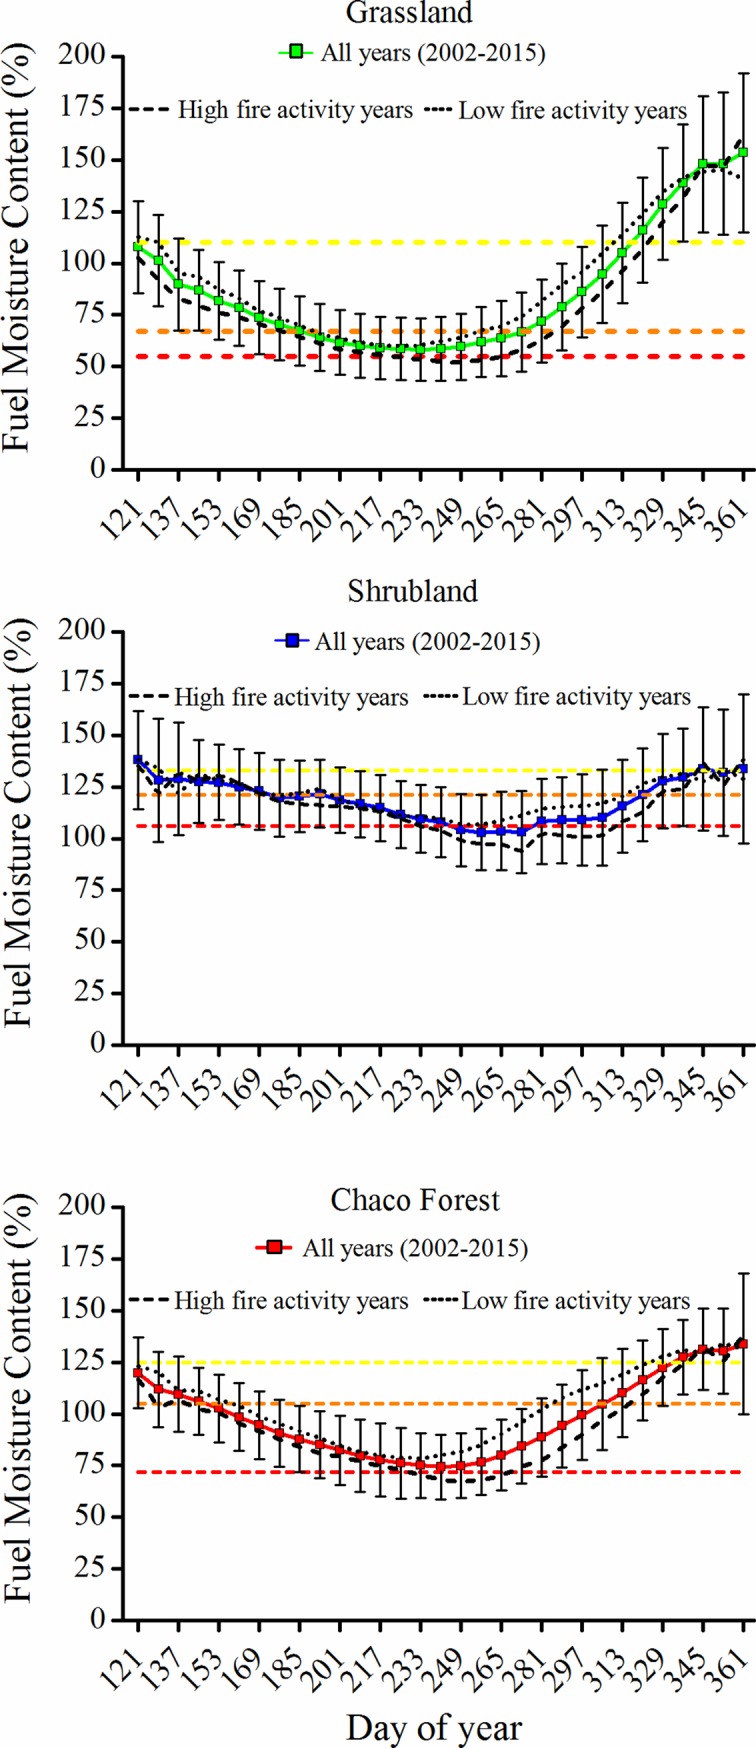
Fig 6. Average fuel moisture content (FMC) values through the fire season for different land cover types in the Sierras Chicas in Córdoba (Argentina) and their comparison with land cover specific fire hazard thresholds.

Average FMC of all years included data from 2002 to 2015. Average FMC for high fire activity years (burned area higher than 3% of total area) included: 2003, 2006, 2008, 2009, 2011 and 2013, and average FMC for low fire activity (burned area lower than 1%) included: 2004, 2007, 2010, 2012, 2014 and 2015. The error bars represent average standard deviation. Dotted horizontal lines indicate the upper limit of extreme (red), high (orange) and moderate fire hazard thresholds (yellow). For reference, the first day of each month corresponds to the following days of year: 152 (June), 185 (July), 213 (August), 244 (September), 274 (October), 305 (November) and 335 (December).
