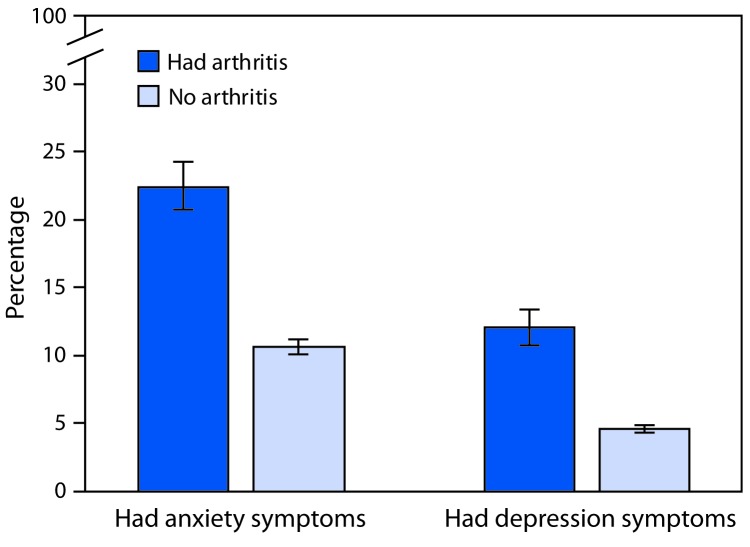
FIGURE 1.
Age-standardized percentage* of adults reporting symptoms of anxiety and depression,† by arthritis§ status — National Health Interview Survey, 2015–2017
* Estimates age-standardized to the 2000 projected U.S. population aged ≥18 years using three groups (18–44 years, 45–64 years, and ≥65 years).
† Respondents were classified based on a frequency question (anxiety: “How often do you feel worried, nervous or anxious?” and depression: “How often do you feel depressed?”) and an intensity question (anxiety: “Thinking about the last time you felt worried, nervous or anxious, how would you describe the level of these feelings?” and depression: “Thinking about the last time you felt depressed, how depressed did you feel?”). Respondents were classified as having symptoms if they responded “daily” or “weekly” to the frequency question and “a lot” or “in between a little and a lot” to the intensity question. Respondents were classified as not having symptoms if they responded “daily” or “weekly” to the frequency question and “a little” to the intensity question, or if they responded “monthly,” “a few times a year,” or “never” to the frequency question. For each symptom, the remaining respondents were excluded from the analysis because their symptom status could not be identified.
§ Respondents were classified as having arthritis if they responded “yes” to “Have you ever been told by a doctor or other health care professional that you have arthritis, rheumatoid arthritis, gout, lupus, or fibromyalgia?”

