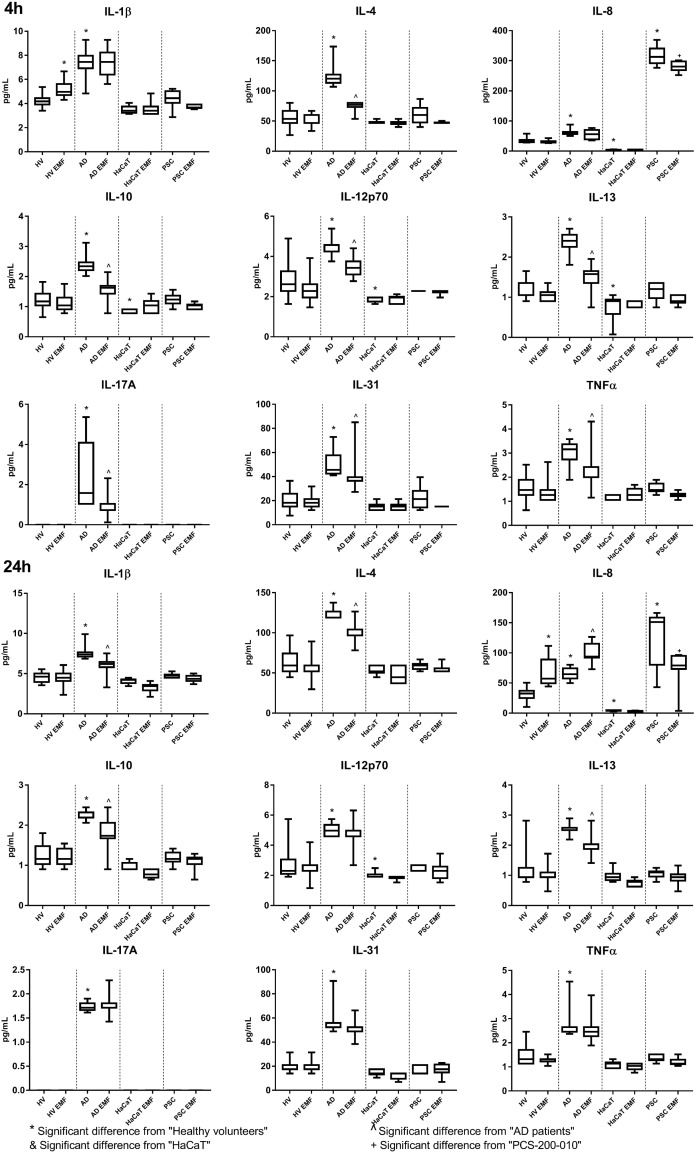
Fig 3. IL-1β, IL-4, IL-8, IL-10, IL-12p70, IL-13, IL-17A, IL-31 and TNFα concentration in keratinocytes.
Results are presented as the median ± the range [pg/mL]. Data acquired using Luminex MagPix. n = 15 for primary cells and n = 10 for cell lines. Results were considered significant for p<0,05, (ANOVA with post-hoc Bonferroni’s test).

