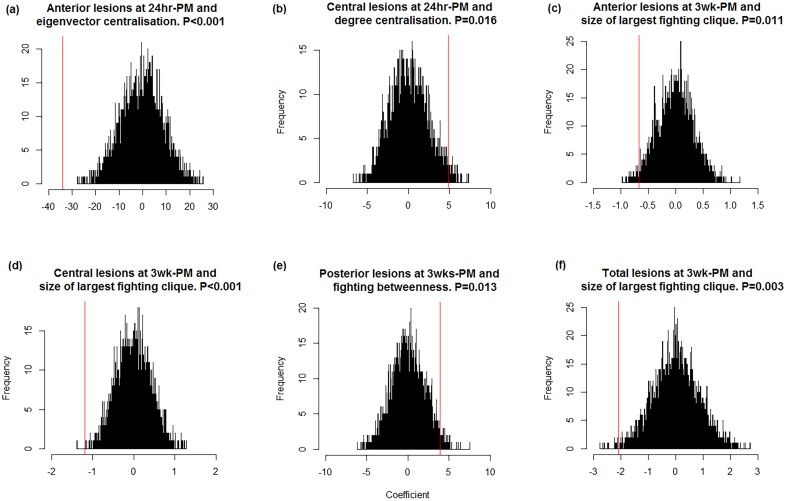
Fig 7. Coefficient frequency distributions from lesion models containing permuted network properties and the coefficient from the observed network models (in red).
The red line represents the coefficient from the observed network properties. The observed value is considered to be significant if fewer than 2.5% of permuted values are greater than the observed value, or 97.5% of the permuted values are greater than the observed [44].

