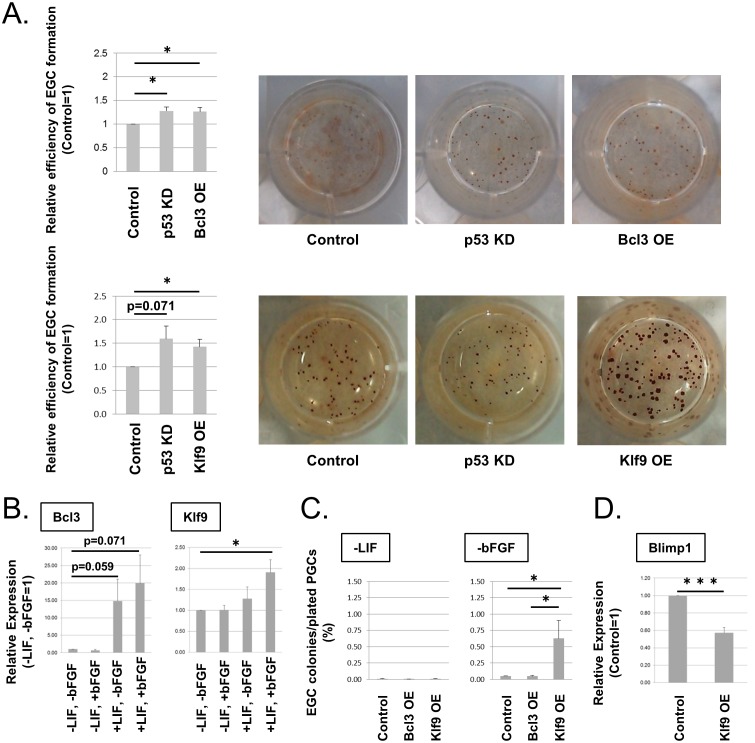
Fig 2. Enhancement of EGC formation by over-expression of Bcl3 and Klf9.
(A) Relative efficiency of EGC formation by Bcl3-OE or Klf9-OE (MOI 5) in PGCs compared with that of control (left). EGC colonies are identified by alkaline phosphatase staining. p53-KD is a positive control. The efficiency of EGC formation by OE or KD of the remaining candidate genes is shown in S3 Fig. Error bars show the SE of three (top) and four (bottom) independent experiments. Representative pictures of stained EGC colonies are shown (right). (B) The expression of Bcl3 and Klf9 in PGCs cultured for 1 day with (+) or without (−) bFGF and/or LIF. Error bars show the SE of three independent experiments. The expression in PGCs cultured without LIF and bFGF was set as 1.0. (C) Efficiency of EGC formation by Bcl3-OE or Klf9-OE in PGCs in the presence of bFGF alone (−LIF) or LIF alone (−bFGF). Error bars show the SE of two (−LIF) or four (−bFGF) independent experiments. (D) The relative expression of Blimp1 in Klf9-OE PGCs cultured for 1 day with LIF alone compared with control PGCs. Error bars show the SE of four independent experiments. The expression was determined by RT-qPCR. *p < 0.05, ***p < 0.001.

