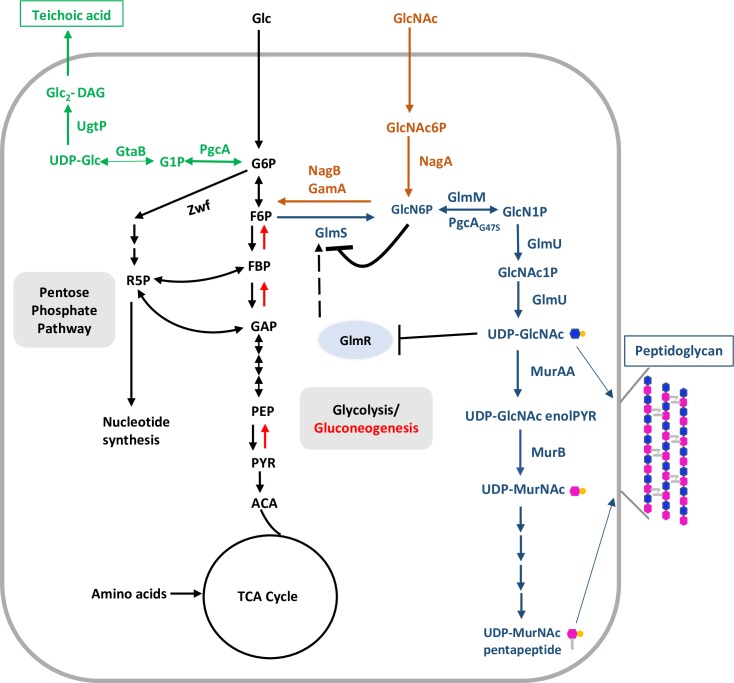
Fig 1. Schematic illustration of central carbon, peptidoglycan, UDP-Glc and UDP-GlcNAc metabolism.
Central carbon metabolism (CCM; glycolysis/gluconeogenesis, pentose phosphate pathway and TCA cycle) is shown with black colored fonts and arrows. Black double headed arrows represent bidirectional enzyme reactions. Single headed black and red arrows represent glycolysis- and gluconeogenesis-specific enzymatic steps, respectively. UDP-Glc biosynthesis and its incorporation in teichoic acids is depicted in green. Steps of peptidoglycan biosynthesis and GlcNAc feeding into central carbon metabolism are shown in blue and orange, respectively. Black dashed arrow indicates activation.

