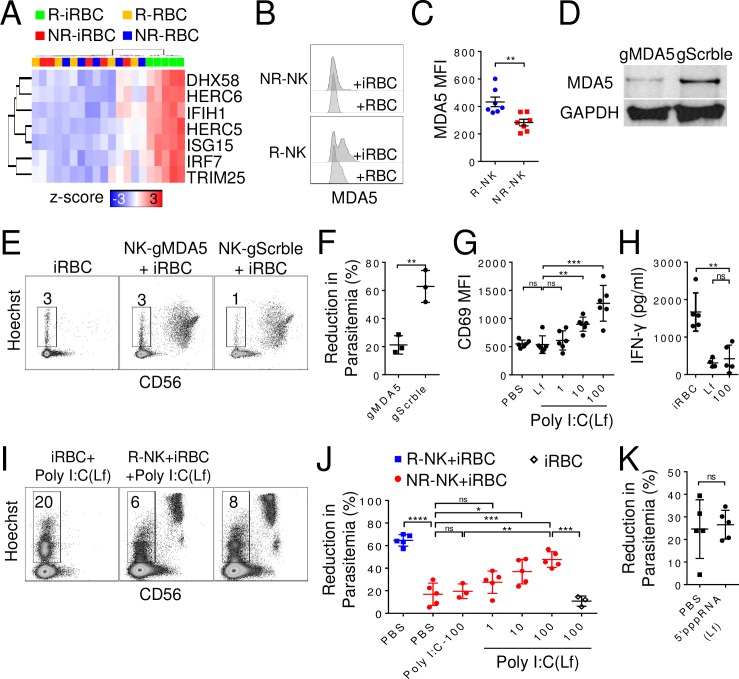
Fig 3. Requirement of MDA5 in NK cell responses to iRBCs.
(A) Heatmap of DEGs involved in RLR signaling. Each column represents an individual of the indicated group. (B-C) NK cells were co-cultured with iRBCs for 96 h, and intracellular staining of MDA5 was analyzed by flow cytometry. Shown are representative histogram (B) and MFI (C) of MDA5 staining of R-NK and NR-NK cells. (D) Western blot of MDA5 and GAPDH levels in R-NK cells transduced with lentivirus expressing CRISPR/Cas9 and a gRNA targeting either MDA5 (gMDA5) or a scramble sequence (gScrble). (E-F) Transduced NK cells were co-cultured with iRBCs for 48 h and parasitemia was quantified. Representative Hoechst vs CD56 staining profiles of iRBCs alone, iRBCs co-cultured with R-NK cells with or without MDA5 knockdown (E) and comparison of reduction in parasitemia (F). Numbers in E indicate parasitemia. (G-H) R-NK cells were co-cultured with either lipofectamine or varying concentrations of lipofectamine-formulated (Lf)-poly I:C for 48 h. Surface expression of CD69 was determined by flow cytometry (G), and IFN-γ secretion was determined by immunoplex assay (H). (I) iRBCs were cultured alone or with either R-NK or NR-NK cells in the presence of 1000μg/ml lipofectamine-formulated poly I:C for 96 h. Parasitemia was quantified by flow cytometry. Representative Hoechst vs CD56 staining profiles is shown. (J) R-NK and NR-NK cells were co-cultured with iRBCs under the indicated conditions for 96 h, and reduction in parasitemia was quantified by flow cytometry. Poly I:C was used at 100 μg/ml (poly I:C-100). poly I:C (Lf) was used at 100, 10 and 1 μg/ml. (K) NR-NK were co-cultured with iRBCs with or without 5’pppRNA (Lf) (10 μg/ml), and reduction in parasitemia was quantified by flow cytometry. Each symbol represents a different individual. Error bars represent mean ± SD. *p<0.05, **p<0.01, ***p<0.001, ****p<0.0001, ns: not significant.

