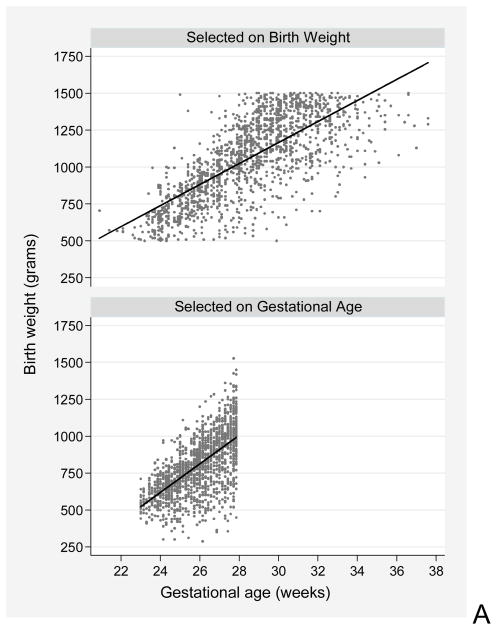
Figure 1.
These scatterplots demonstrate how birth weight and gestational age distributions of newborns differ depending on enrollment criteria. The top scatterplot is of newborns enrolled on the basis of a birth weight < 1500g(14). All infants whose gestational age at birth is > 33 weeks are in the lowest decile of birth weight for gestational age. The bottom scatterplot is of newborns enrolled on the basis of a gestational age < 28 weeks (9), which avoids the excess of growth-restricted infants seen in the top scatterplot. The lines are regression lines for each sample.

