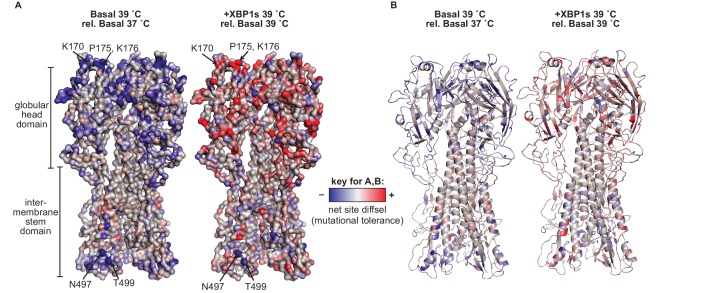
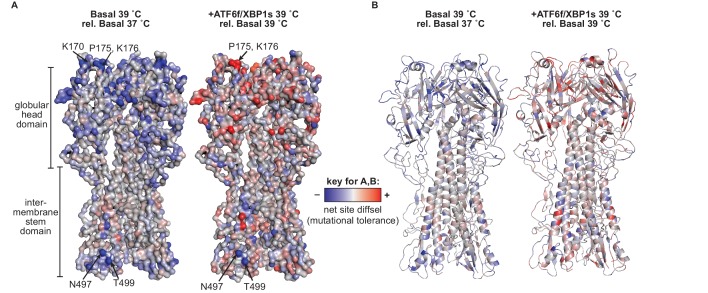
Figure 8. Mutational tolerance at sites across the mature HA protein was impacted by XBP1s induction and increased temperature.
(A) Average net site diffsel values (which correspond to mutational tolerance) are mapped onto the HA crystal structure PDBID 1RVX (Gamblin et al., 2004), with select outliers from Figure 7 labeled. (B) Cartoon representation of A displaying secondary structural elements. In A–B, negative net site diffsel values are mapped in blue; positive net site diffsel values are mapped in red. Figure 8—figure supplement 1. Mutational tolerance at sites across the mature HA protein was impacted by ATF6f/XBP1s induction and increased temperature.


