Figure 3.

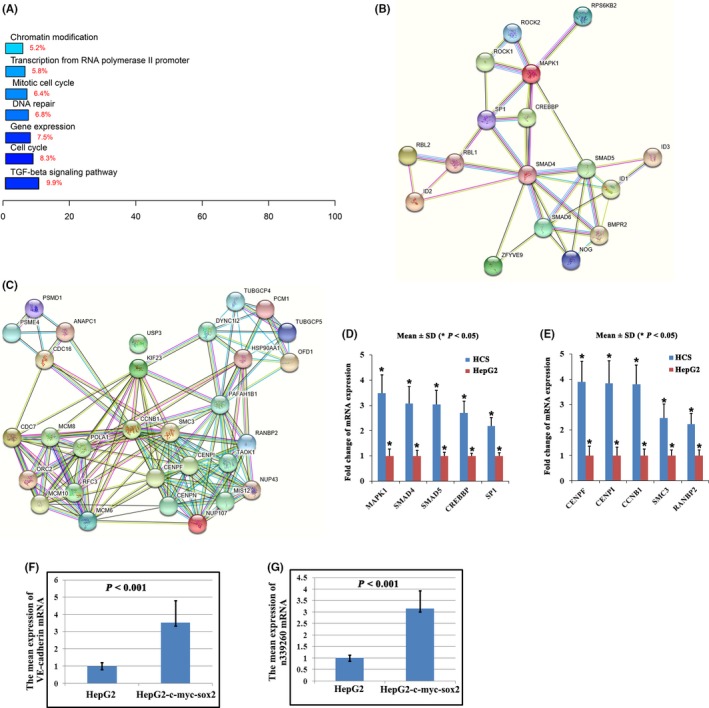
Molecular profiling of HepG2‐c‐Myc‐SOX2 (HCS) cells and control HepG2 cells. A, Kyoto Encyclopedia of Genes and Genomes (KEGG) pathway and gene ontology (GO) analysis of c‐Myc/SOX2‐regulated targets. B‐C, Functional association network of genes in transforming growth factor beta (TGF‐β) signaling pathway (B) and mitotic cell cycle (C) by Search Tool for the Retrieval of Interacting Genes/Proteins (STRING) analysis. D‐E, Expression changes validation of the 5 selected genes in the TGF‐β signaling pathway (D) and mitotic cell cycle (E) by qRT‐PCR. F, qRT‐PCR indicates that vascular endothelial (VE)‐cadherin mRNA shows a higher expression in HCS than in control cells. G, Noncoding RNA n339260 was confirmed to show a higher expression in HCS cells than in control cells by qRT‐PCR
