
Figure 3.
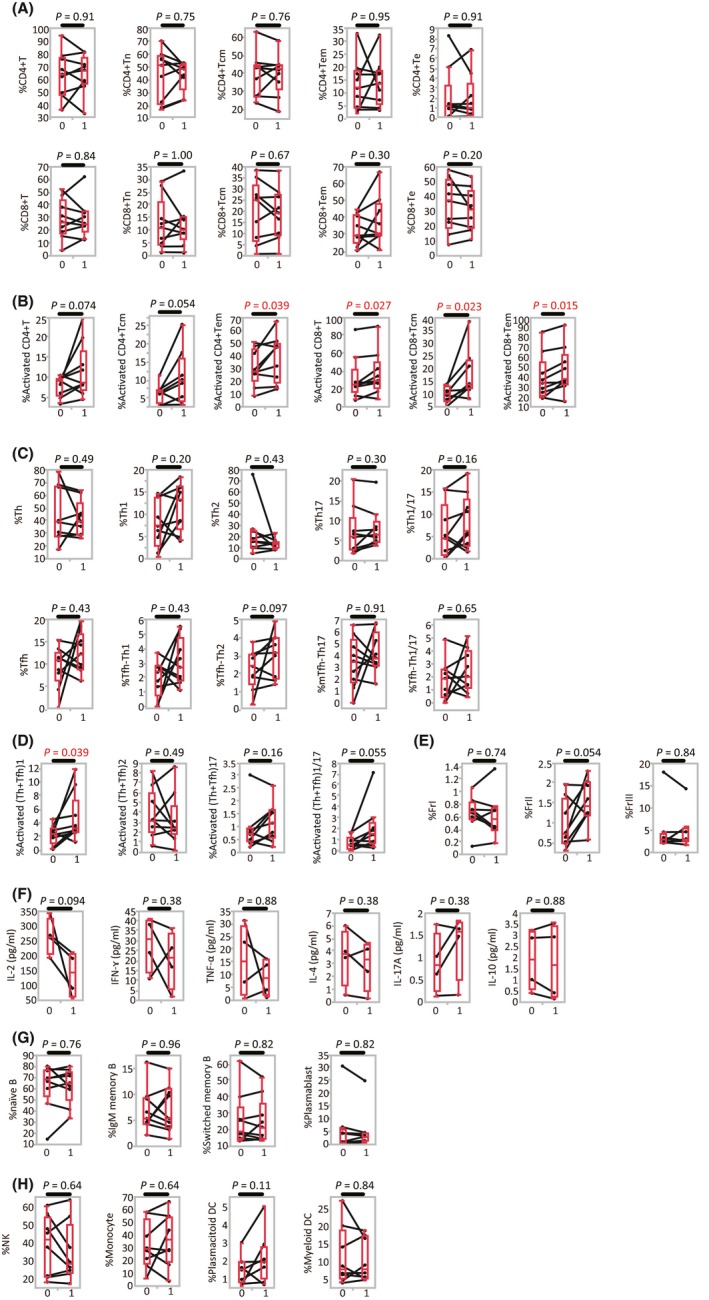
Change in immune cell phenotypes after anti‐programmed death (anti‐PD)‐1 antibody treatment (n = 9). A, Proportion of CD4+(CD8+) T cells among CD3+ T lymphocytes, and CD4+(CD8+) naive T cells (Tn), central memory T cells (Tcm), effector memory T cells (Tem), and effector T cells (Te) among CD4+(CD8+) T cells. B, Proportion of activated CD4+(CD8+) central/effector memory cells. C, Proportion of T‐helper (Th), T‐helper follicular (Tfh) cells, and Th subsets among CD4+ T cells. D, Proportion of activated Th subsets (Th plus Tfh) among CD4+ T cells. E, Proportion of regulatory T cells (Treg) fractions (Fr I, II and III) among CD4+ T cells. F, CD4+ memory T cells (CD3+CD4+CD45RA‐) were sorted and cultured with CD3/CD28 stimulation for 48 h. Culture supernatants were analyzed for the quantification of different cytokines by LEGENDplex (BioLegend, San Diego, CA, USA). The concentration is shown as the production per 104 cells. G, Proportion of naïve B cells, IgM memory B cells, switched memory B cells and plasmablasts among CD19+ B cells. H, Proportion of natural killer (NK) cells, monocytes, and dendritic cells (DC) among CD3‐CD19‐ mononuclear cells. Cycle 0, pre‐treatment, that is, prior to the first PD‐1 antibody cycle; cycle 1, post‐first treatment cycle (ie prior to the second PD‐1 antibody cycle); Matched patient samples are connected by lines [Correction added on 24 September 2018, after first online publication: The missing X axis labels were added to Figure 3.]