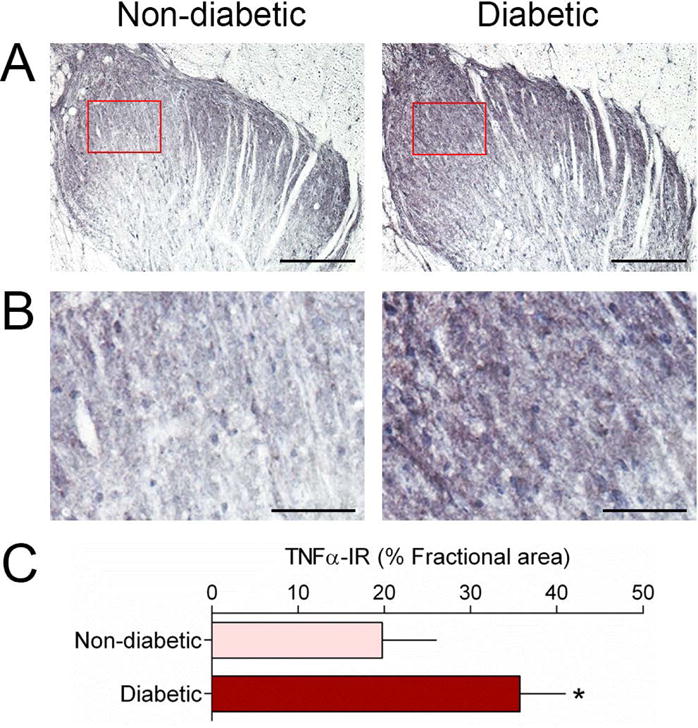
Figure 2. Upregulation of TNFα immunoreactivity in the spinal dorsal horn of diabetic monkeys.

Representative images of TNFα immunohistochemistry in non-diabetic and diabetic monkeys (A). Higher magnification of the boxed area in panel A showing a denser immunostaining in the diabetic group (B). Quantification of TNFα immunostaining was expressed as the fractional area which reflects the percentage of the sampled area that fell within a defined density threshold (C). Scale bars, 200 μm (A) and 50 μm (B). Each value is presented as the mean ± SEM. (n = 6–7). *P < 0.05 vs. non-diabetic.
