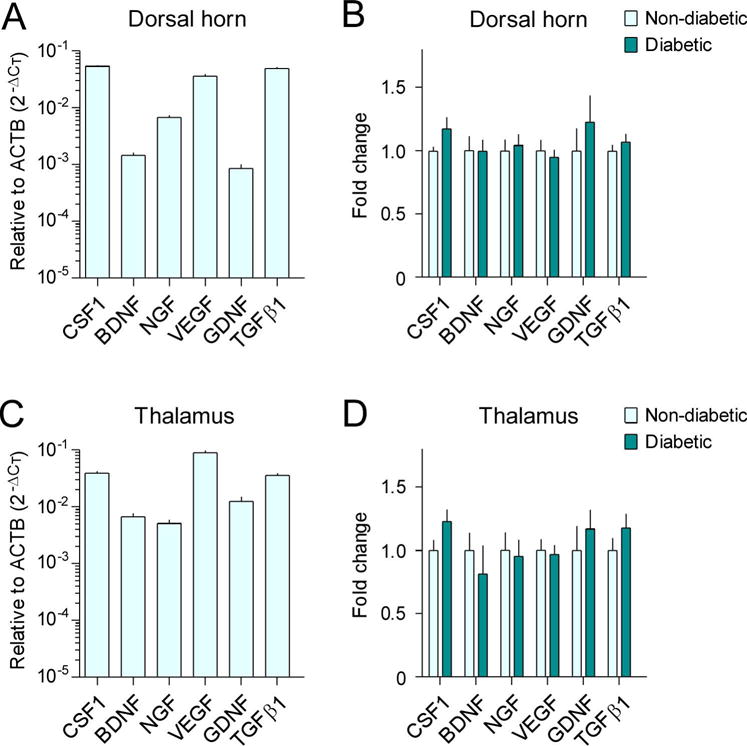
Figure 5. Expression of growth factors in the spinal dorsal horn and thalamus of diabetic monkeys.

The mRNA expression levels of CSF1, BDNF, NGF, VEGF, GDNF, and TGFβ1 in the spinal dorsal horn (A, B) and thalamus (C, D) were evaluated with RT-qPCR using the comparative CT method (2−ΔCT). The basal mRNA expression levels of these growth factors relative to β-actin (ACTB) in the non-diabetic group are shown in A and C. Fold changes of mRNA expression levels in the type 2 diabetic group compared to those in the non-diabetic control group are shown in B and D. Each value is presented as the mean ± SEM (n=6–7).
