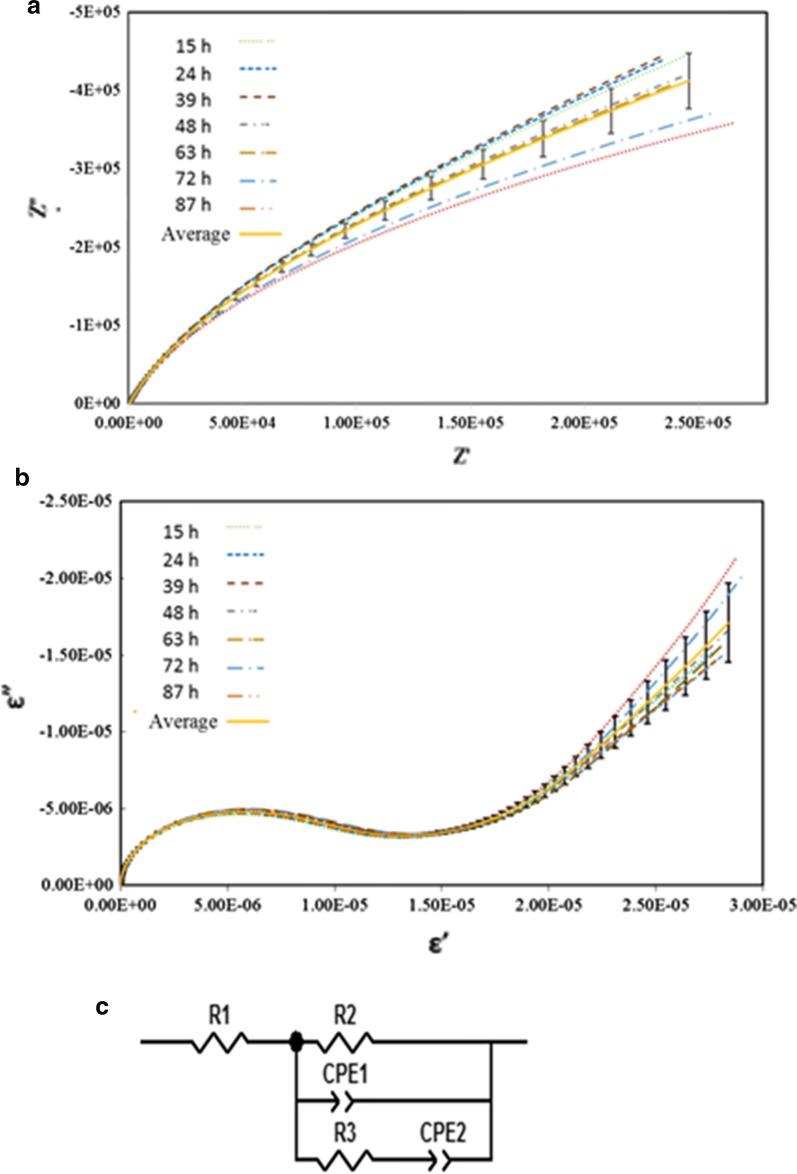
Fig. 4.
EIS results from abiotic controls from both Bode (a) and Nyqyist (b) plots demonstrated minimal drift and good precision from 100 kHz to 0.01 Hz. throughout the course of the study. The equivalent circuit (c) used to fit the data where R1 represents electrolyte resistance at high frequency, CPE1 and R2 represent a constant phase element and charge transfer resistance, respectively at lower to medium frequencies, with CPE2 and R3 representing a constant phase element and a modification of the charge transfer resistance respectively at low to high frequencies

